Your company at a glance

The dashboard is the first screen you see in Noyax: where your money is, whether your sales are really growing, what you’ll collect and pay in the coming days. You decide which charts appear and in what order.

Every Noyax account has the dashboard; it feeds itself from your records.

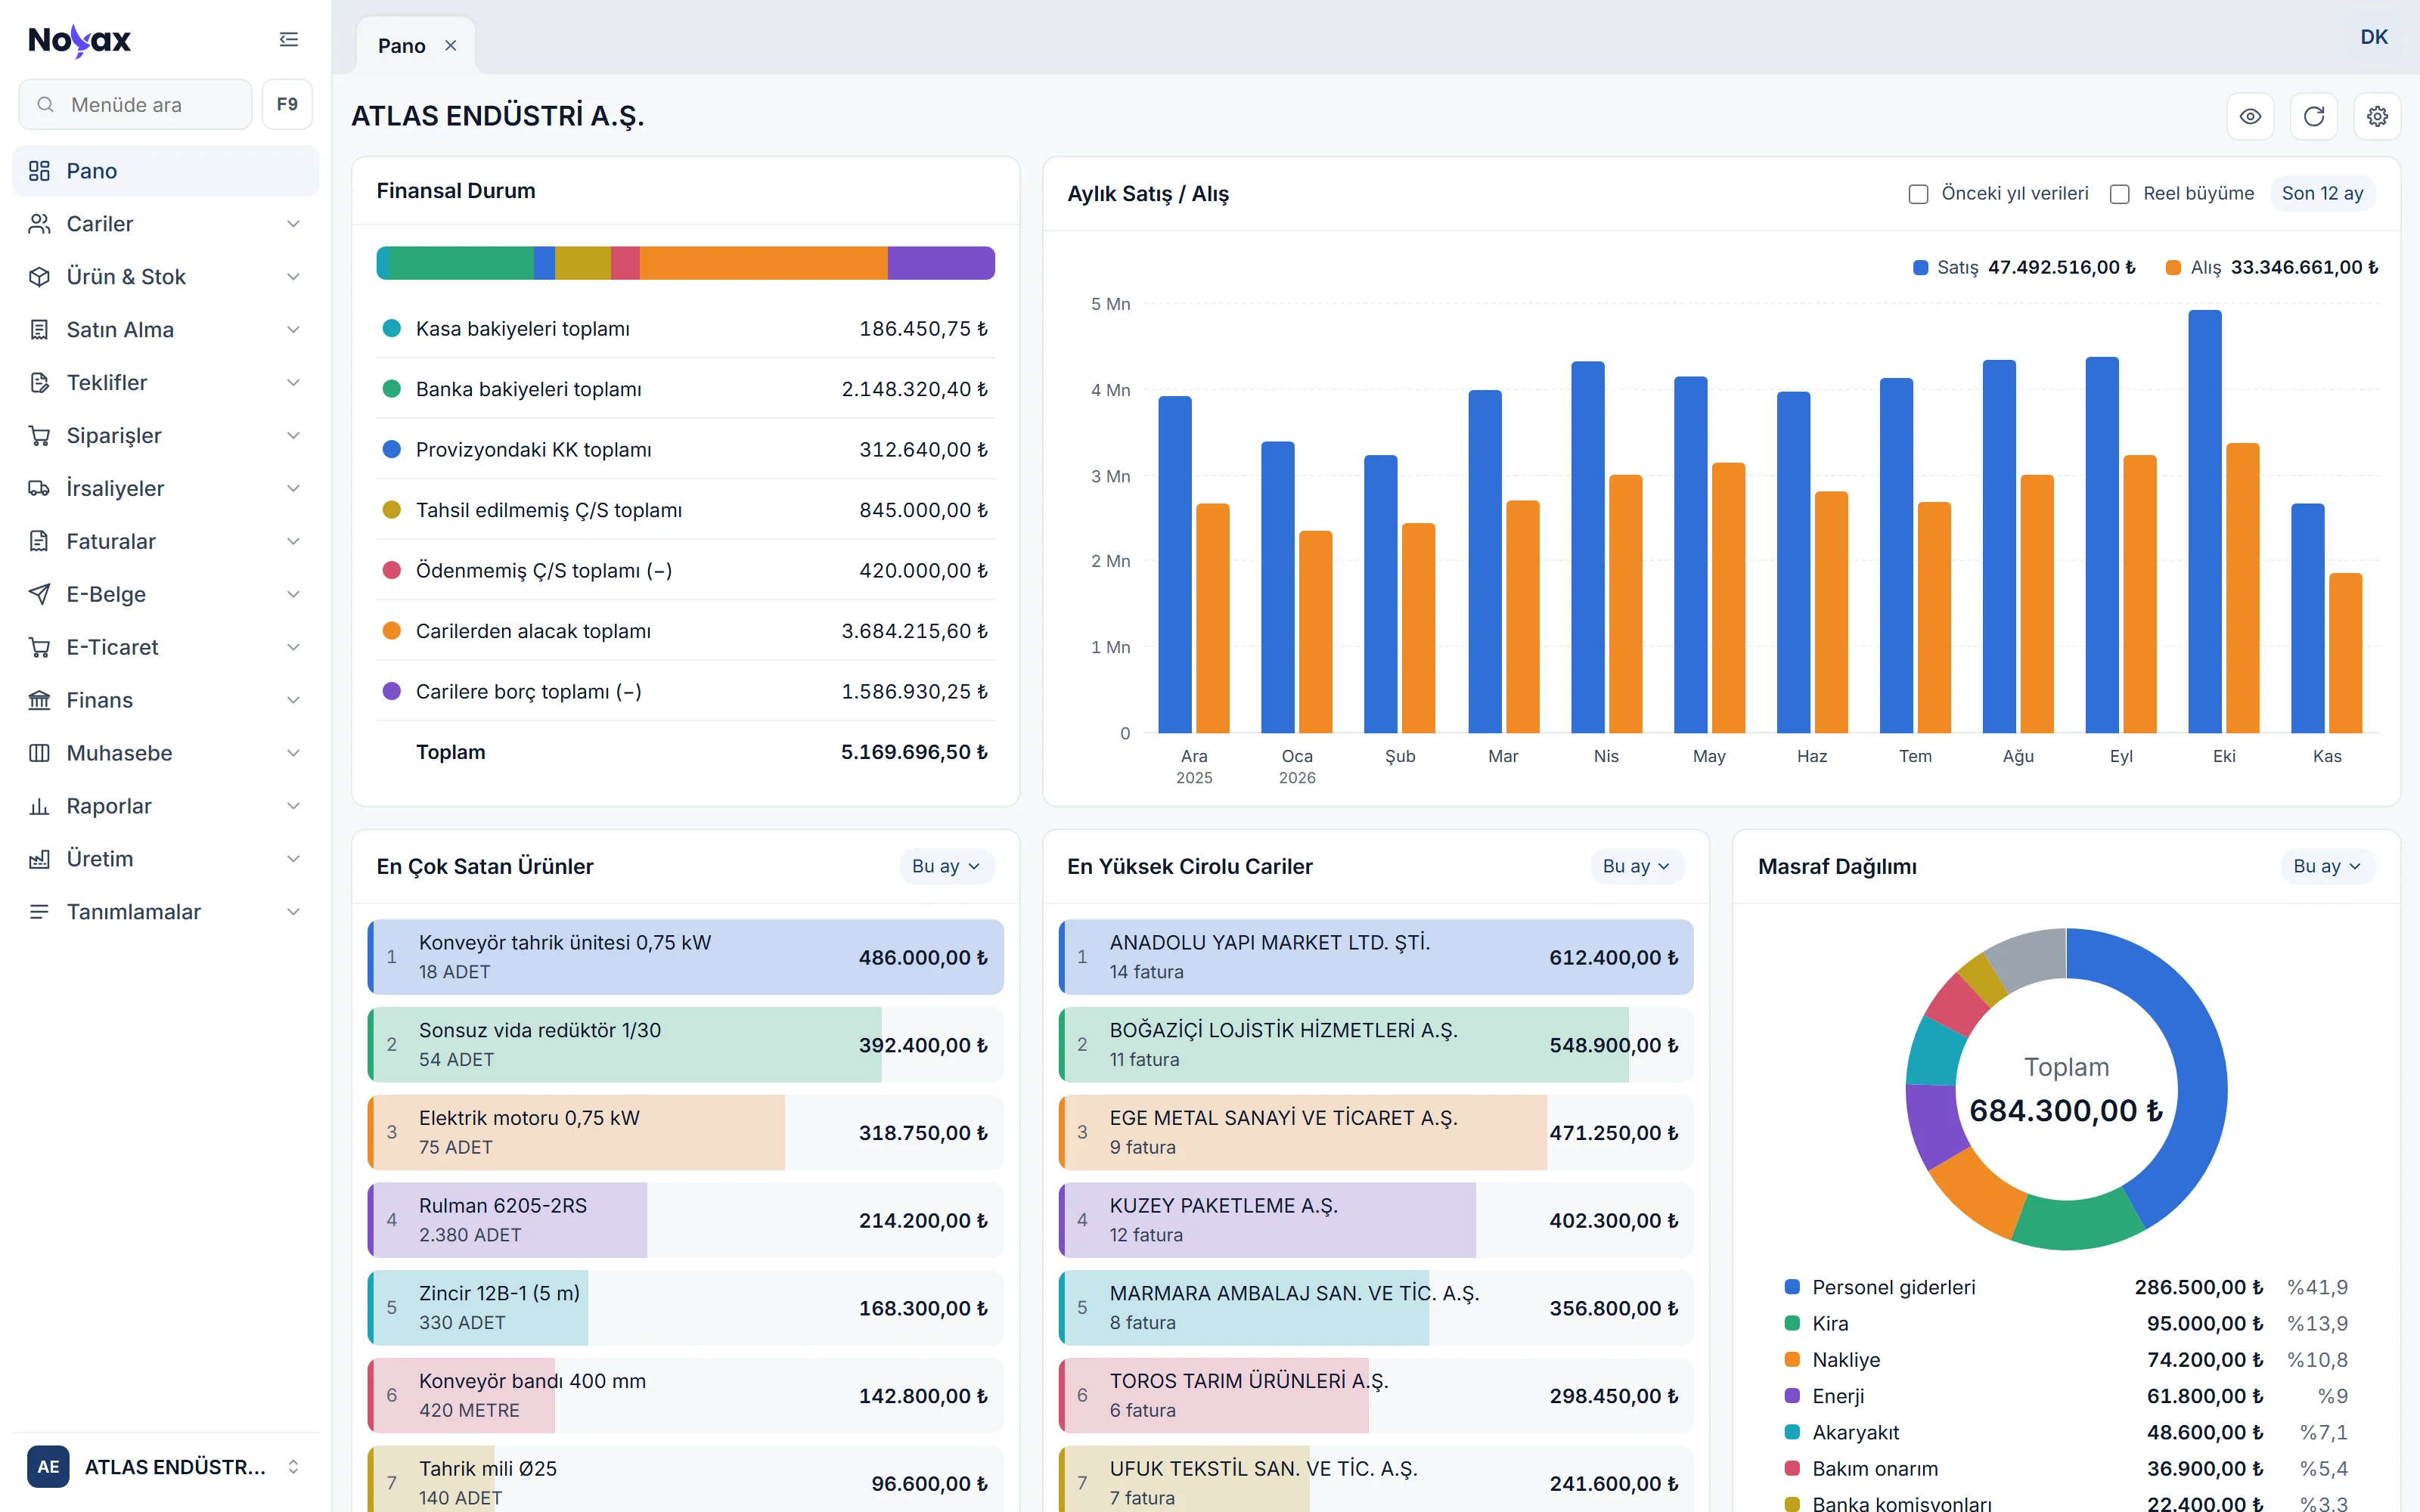
The Noyax dashboard: the menu on the left; Financial position, the Monthly sales / purchases column chart, Best-selling products, Top customers by revenue and Expense breakdown

Are your sales really growing?

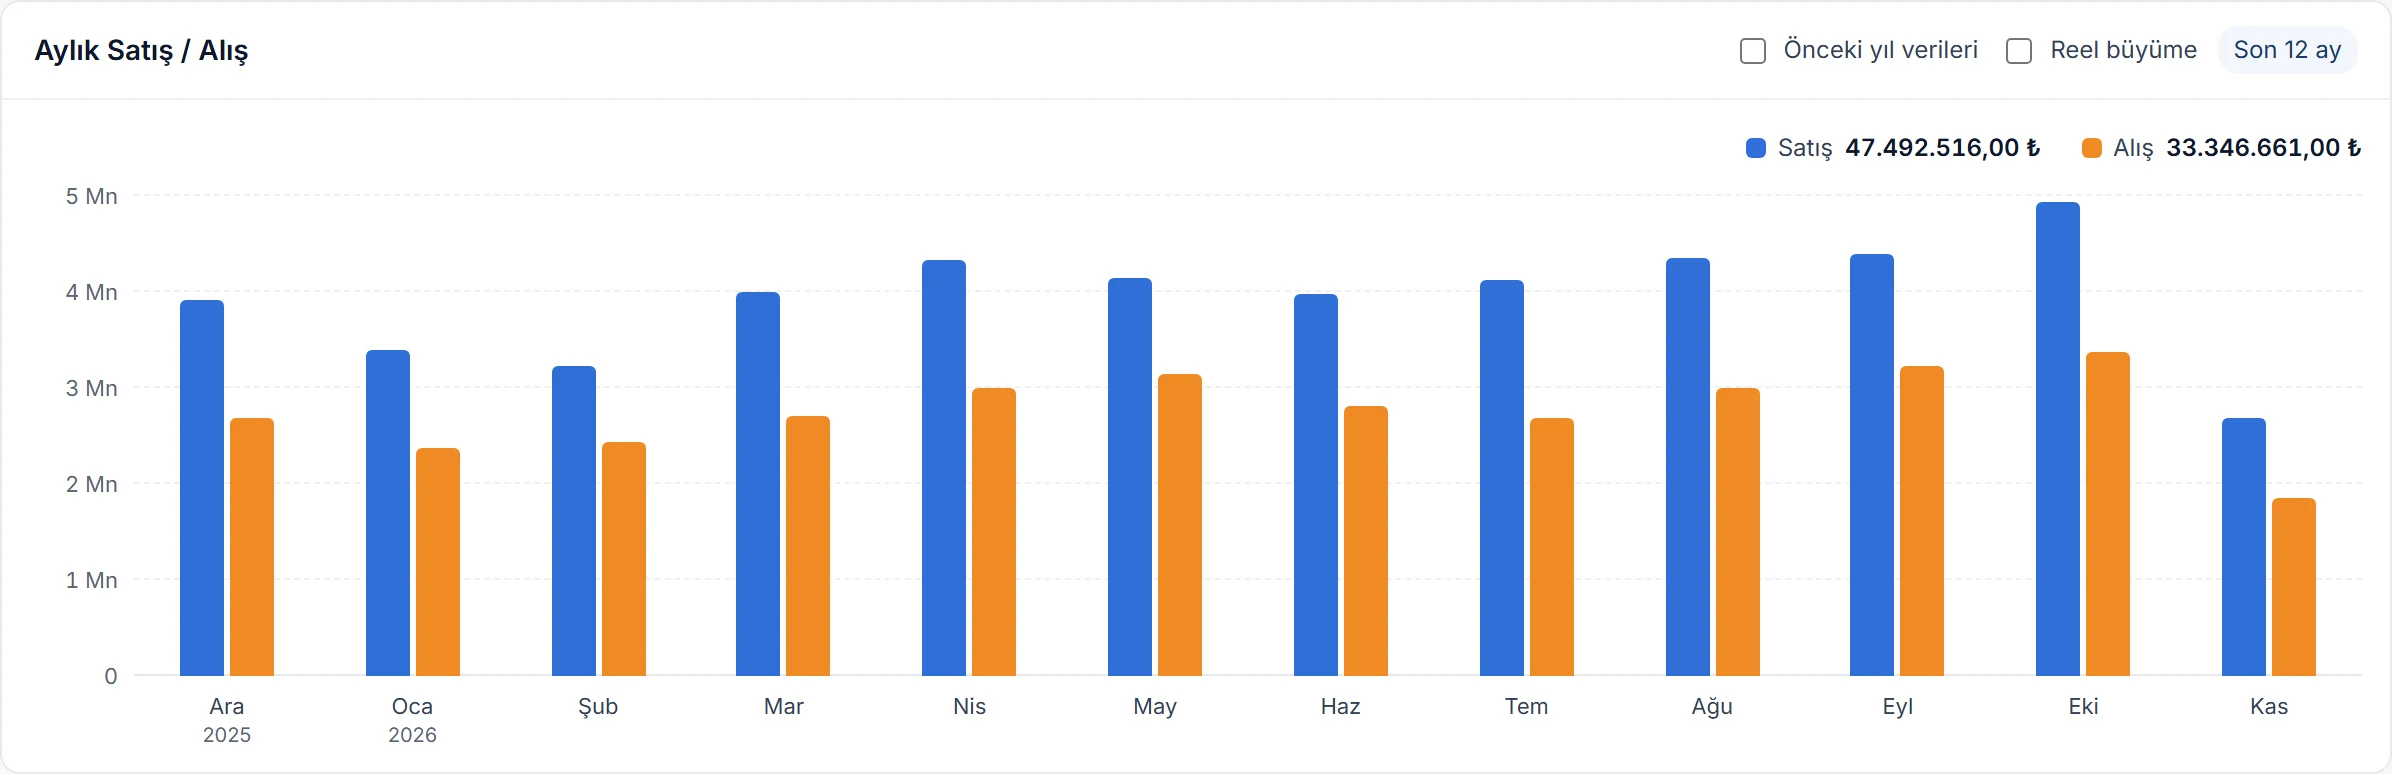
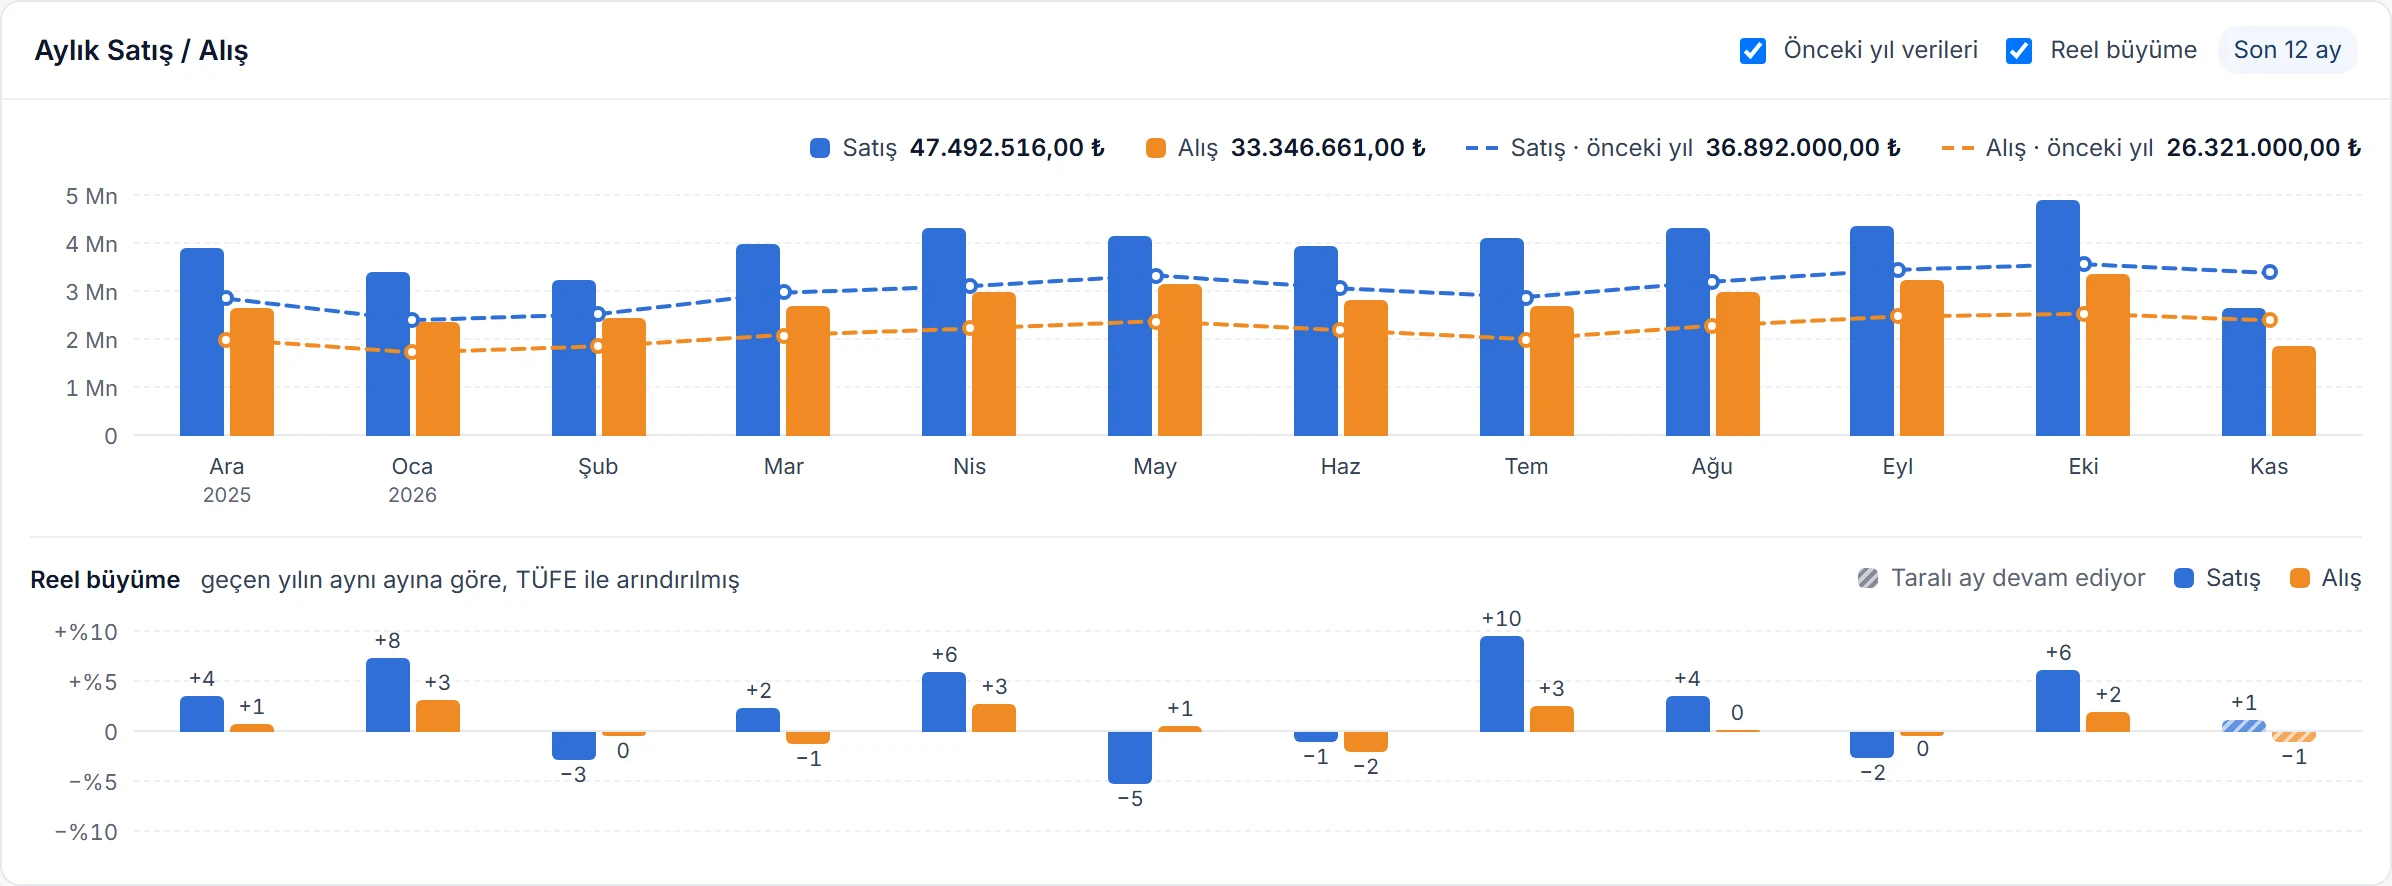
The Monthly sales / purchases chart shows sales and purchase invoices for the last 12 months, this month included, as columns side by side. The two boxes in the card’s header answer the question behind the numbers: where do you stand against last year, and what is left once inflation is taken out?

Last 12 months Blue columns are sales, orange columns purchases: the grand total of invoices including VAT. The 12-month total of each series is shown on top; hover a column for the month’s amount and invoice count.
Monthly sales / purchases card: sales in blue and purchases in orange columns for the last 12 months; 12-month totals on top Enlarge image
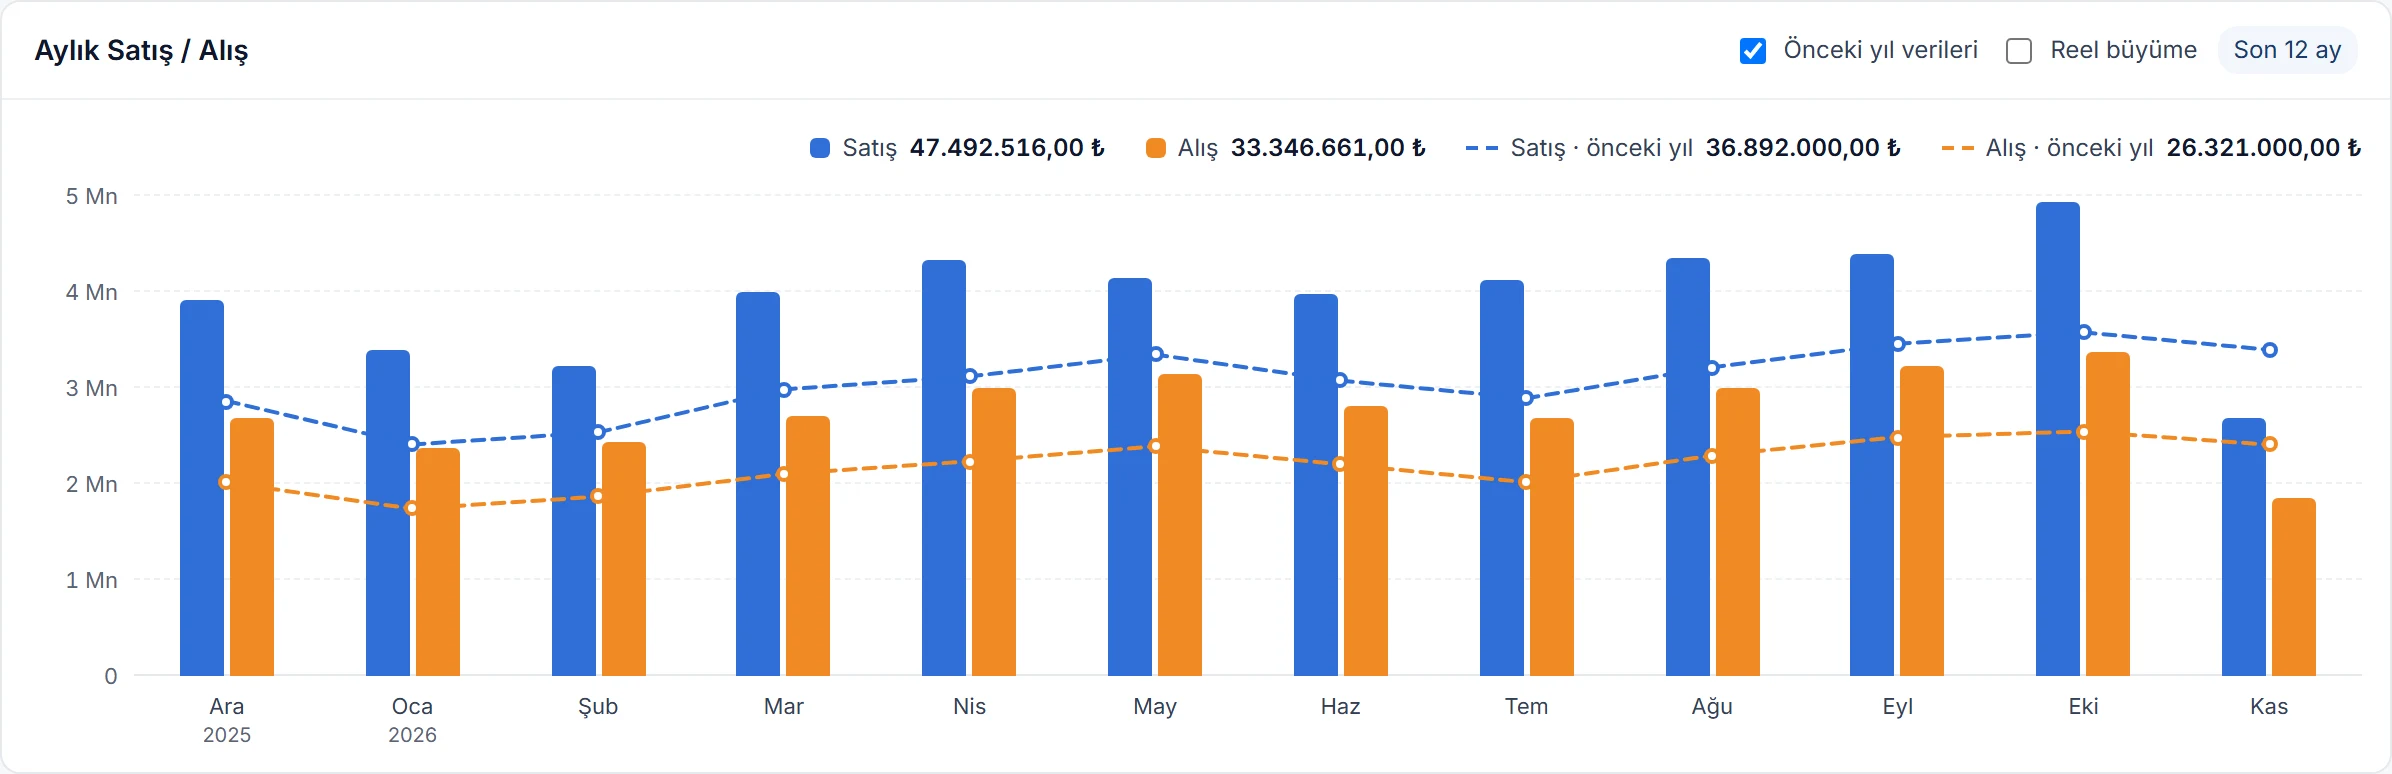
Previous year The same months last year are drawn as dashed lines in each series’ colour, with last year’s totals in the legend. This month’s column runs to today, so it can sit below the line until the month ends.
Previous year ticked: last year’s sales and purchases as dashed lines over the columns Enlarge image
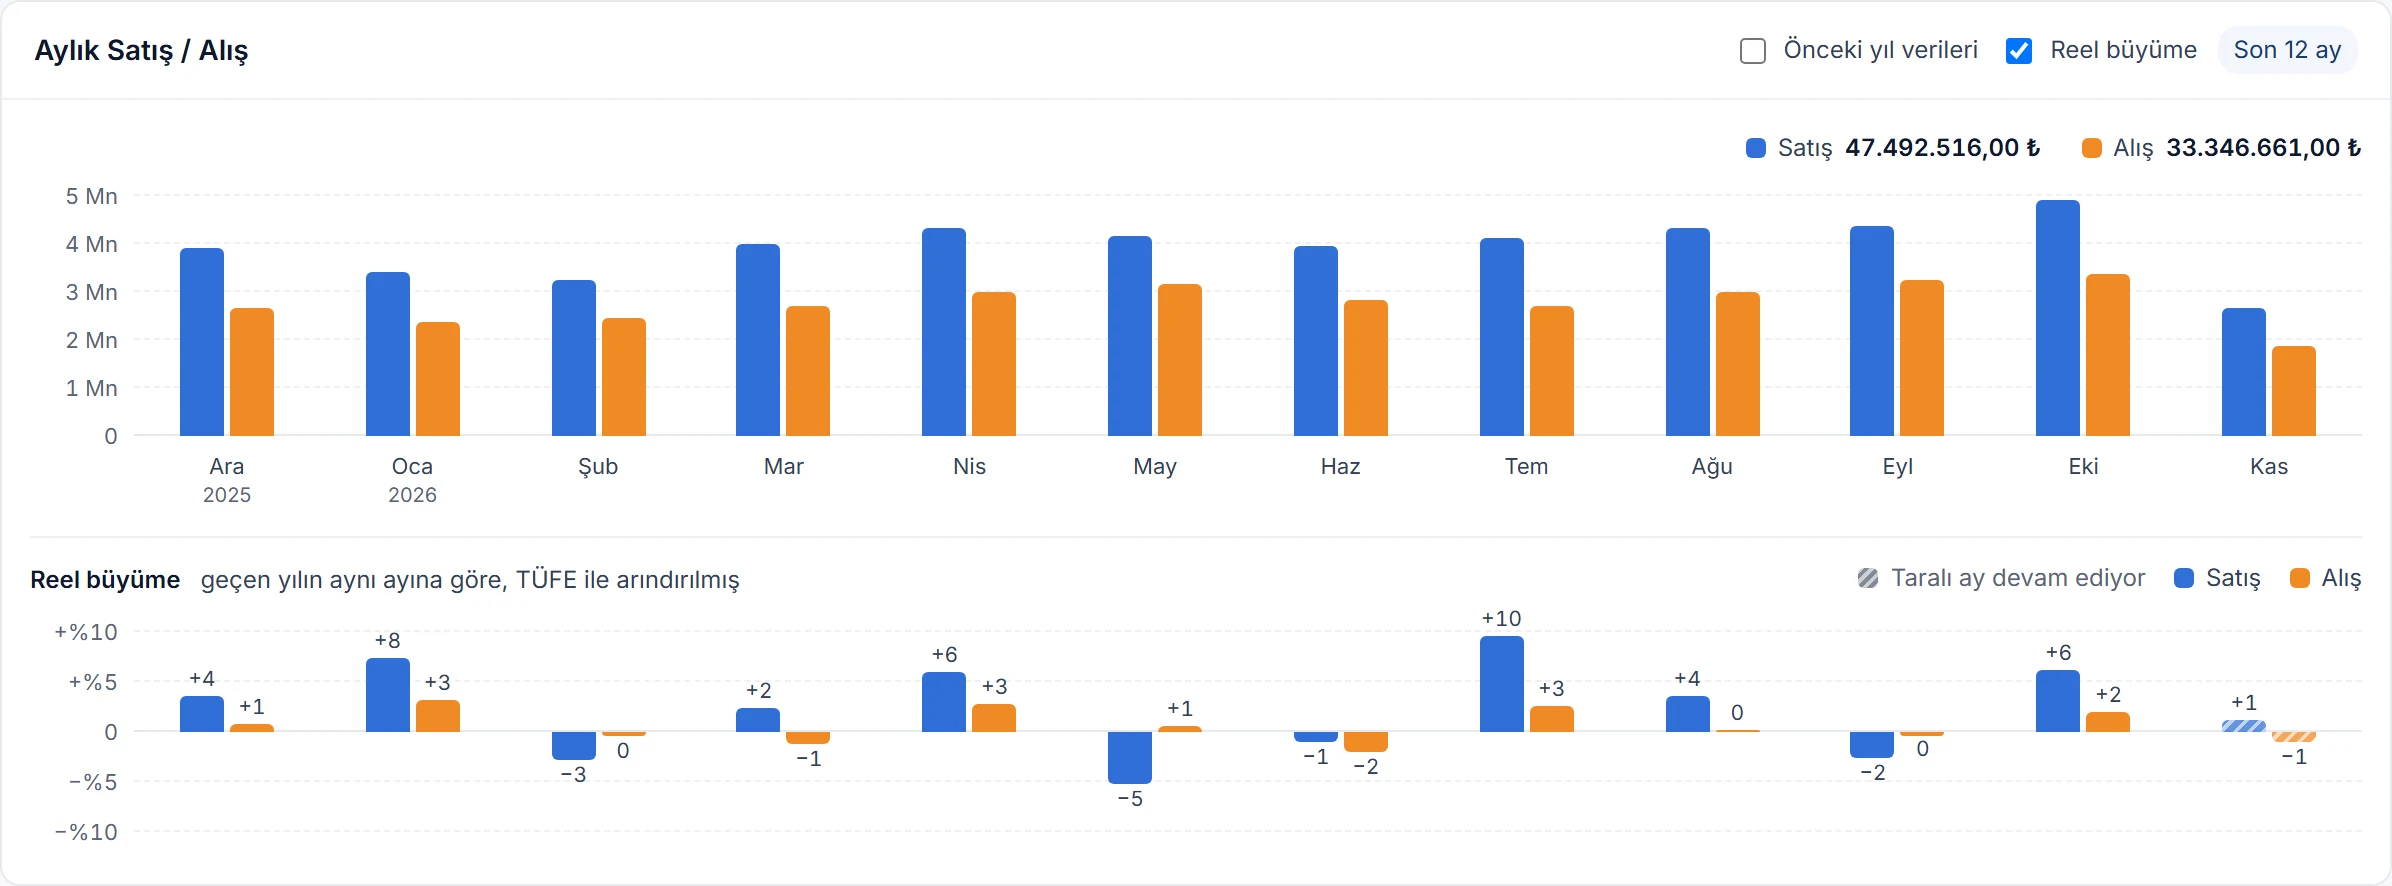
Real growth A growth chart aligned to the same months opens under the columns. A bar pointing up means you grew faster than inflation that month; pointing down means you shrank — even sales that rose in lira can be a real decline.
Real growth ticked: under the columns, each month’s inflation-adjusted growth of sales and purchases as bars pointing up or down Enlarge image
Both together The two boxes are independent. Tick both to see last year’s amounts and inflation-adjusted growth on the same card.
Previous year and Real growth together: columns, last year’s dashed lines and real growth bars below Enlarge image
How is real growth calculated?
September last year
TRY 1,000,000
September this year
TRY 1,340,000
Growth in lira
+34.0%
Annual CPI
29.8%
Real growth
+3.2%

(1,340,000 ÷ 1,000,000) ÷ 1.298 − 1 = +3.2%

Inflation is the annual CPI published by the Central Bank of the Republic of Türkiye; the same rate applies to sales and purchases.

  • The current month isn’t over, so it’s compared with the same days last year and its bar is hatched; CPI comes from the latest published month.
  • Hover a bar to see last year’s and this year’s amounts, growth in lira, annual CPI and real growth together.
  • If there were no sales or purchases in the same month last year, growth can’t be calculated and no bar is drawn.
  • The boxes are saved to your user, so the dashboard looks the same next time.
  • Real growth appears when the company’s default currency is the Turkish lira.

Pick the charts you want to see

In the Dashboard charts window, opened with the gear icon, every chart has a box next to it. Untick a chart and it leaves the dashboard, so details you don’t care about don’t crowd your screen. Add it back from the same window any time.

  • Change the order of the charts with the arrows; that is the order on the dashboard.
  • Charts with a date range get their range here too, and the Markets row opens its symbols.
  • Choices are saved to your user: the same on every computer, and they don’t change anyone else’s dashboard.
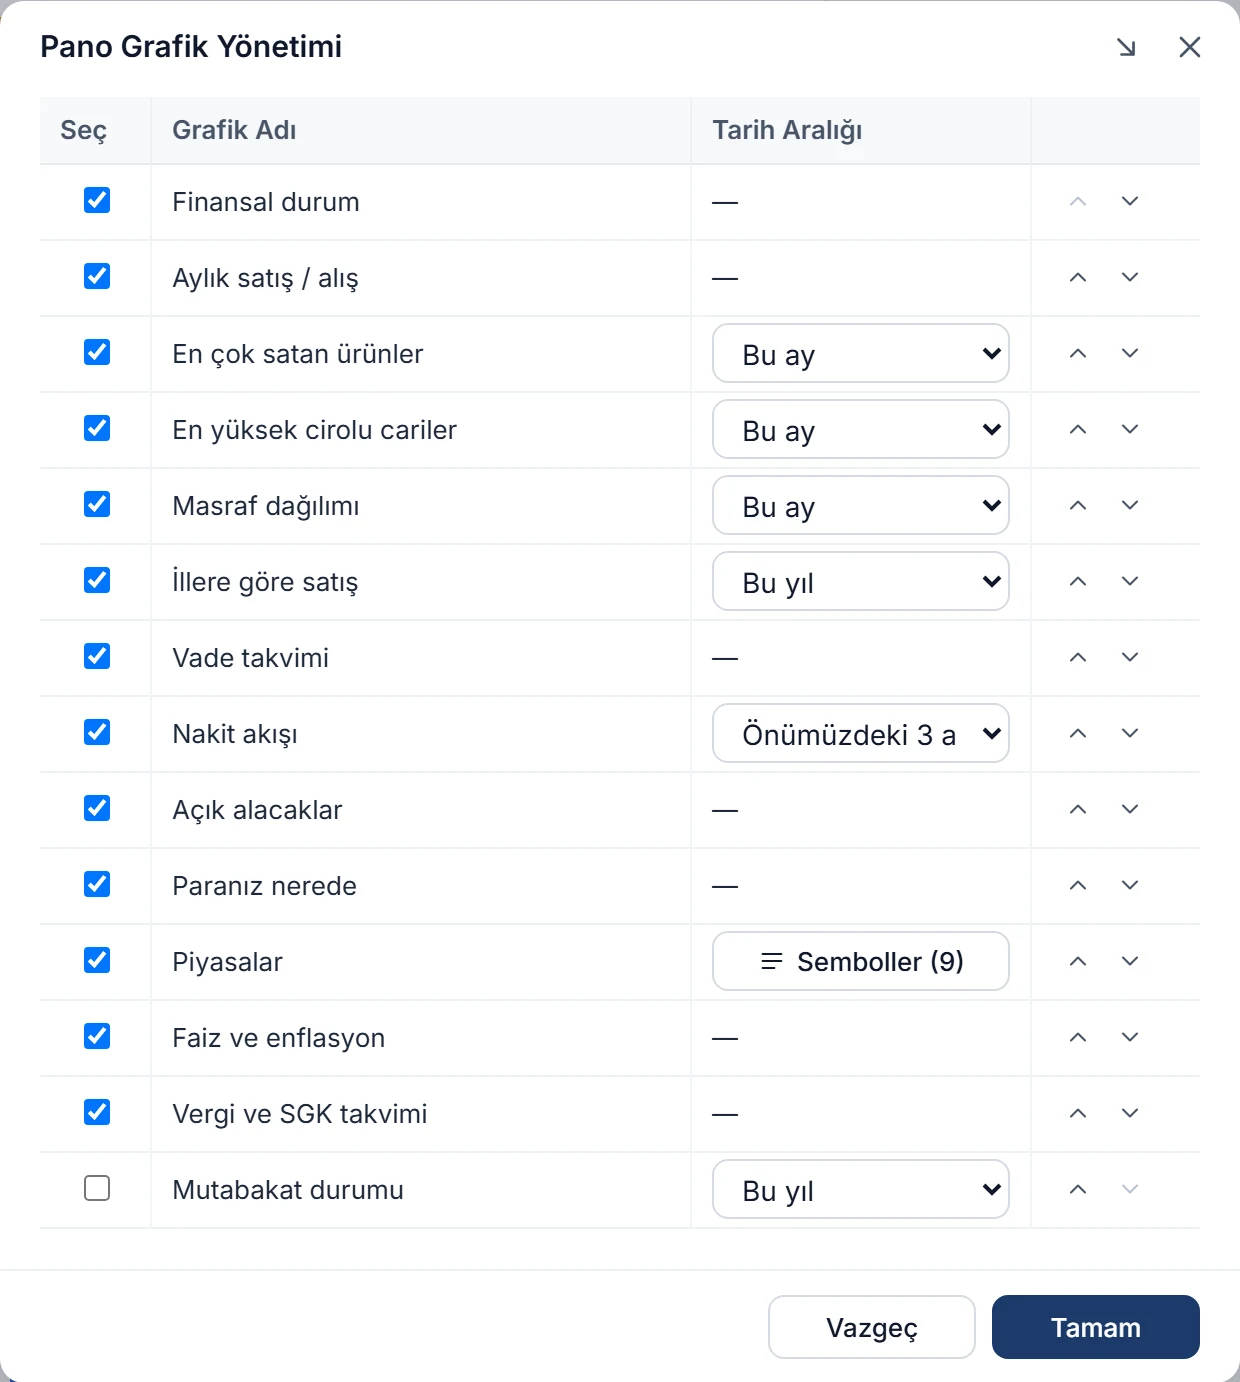
The Dashboard charts window: each chart’s Select box, name, date range and order arrows; Balance confirmation status unticked Enlarge image

Drag cards into place

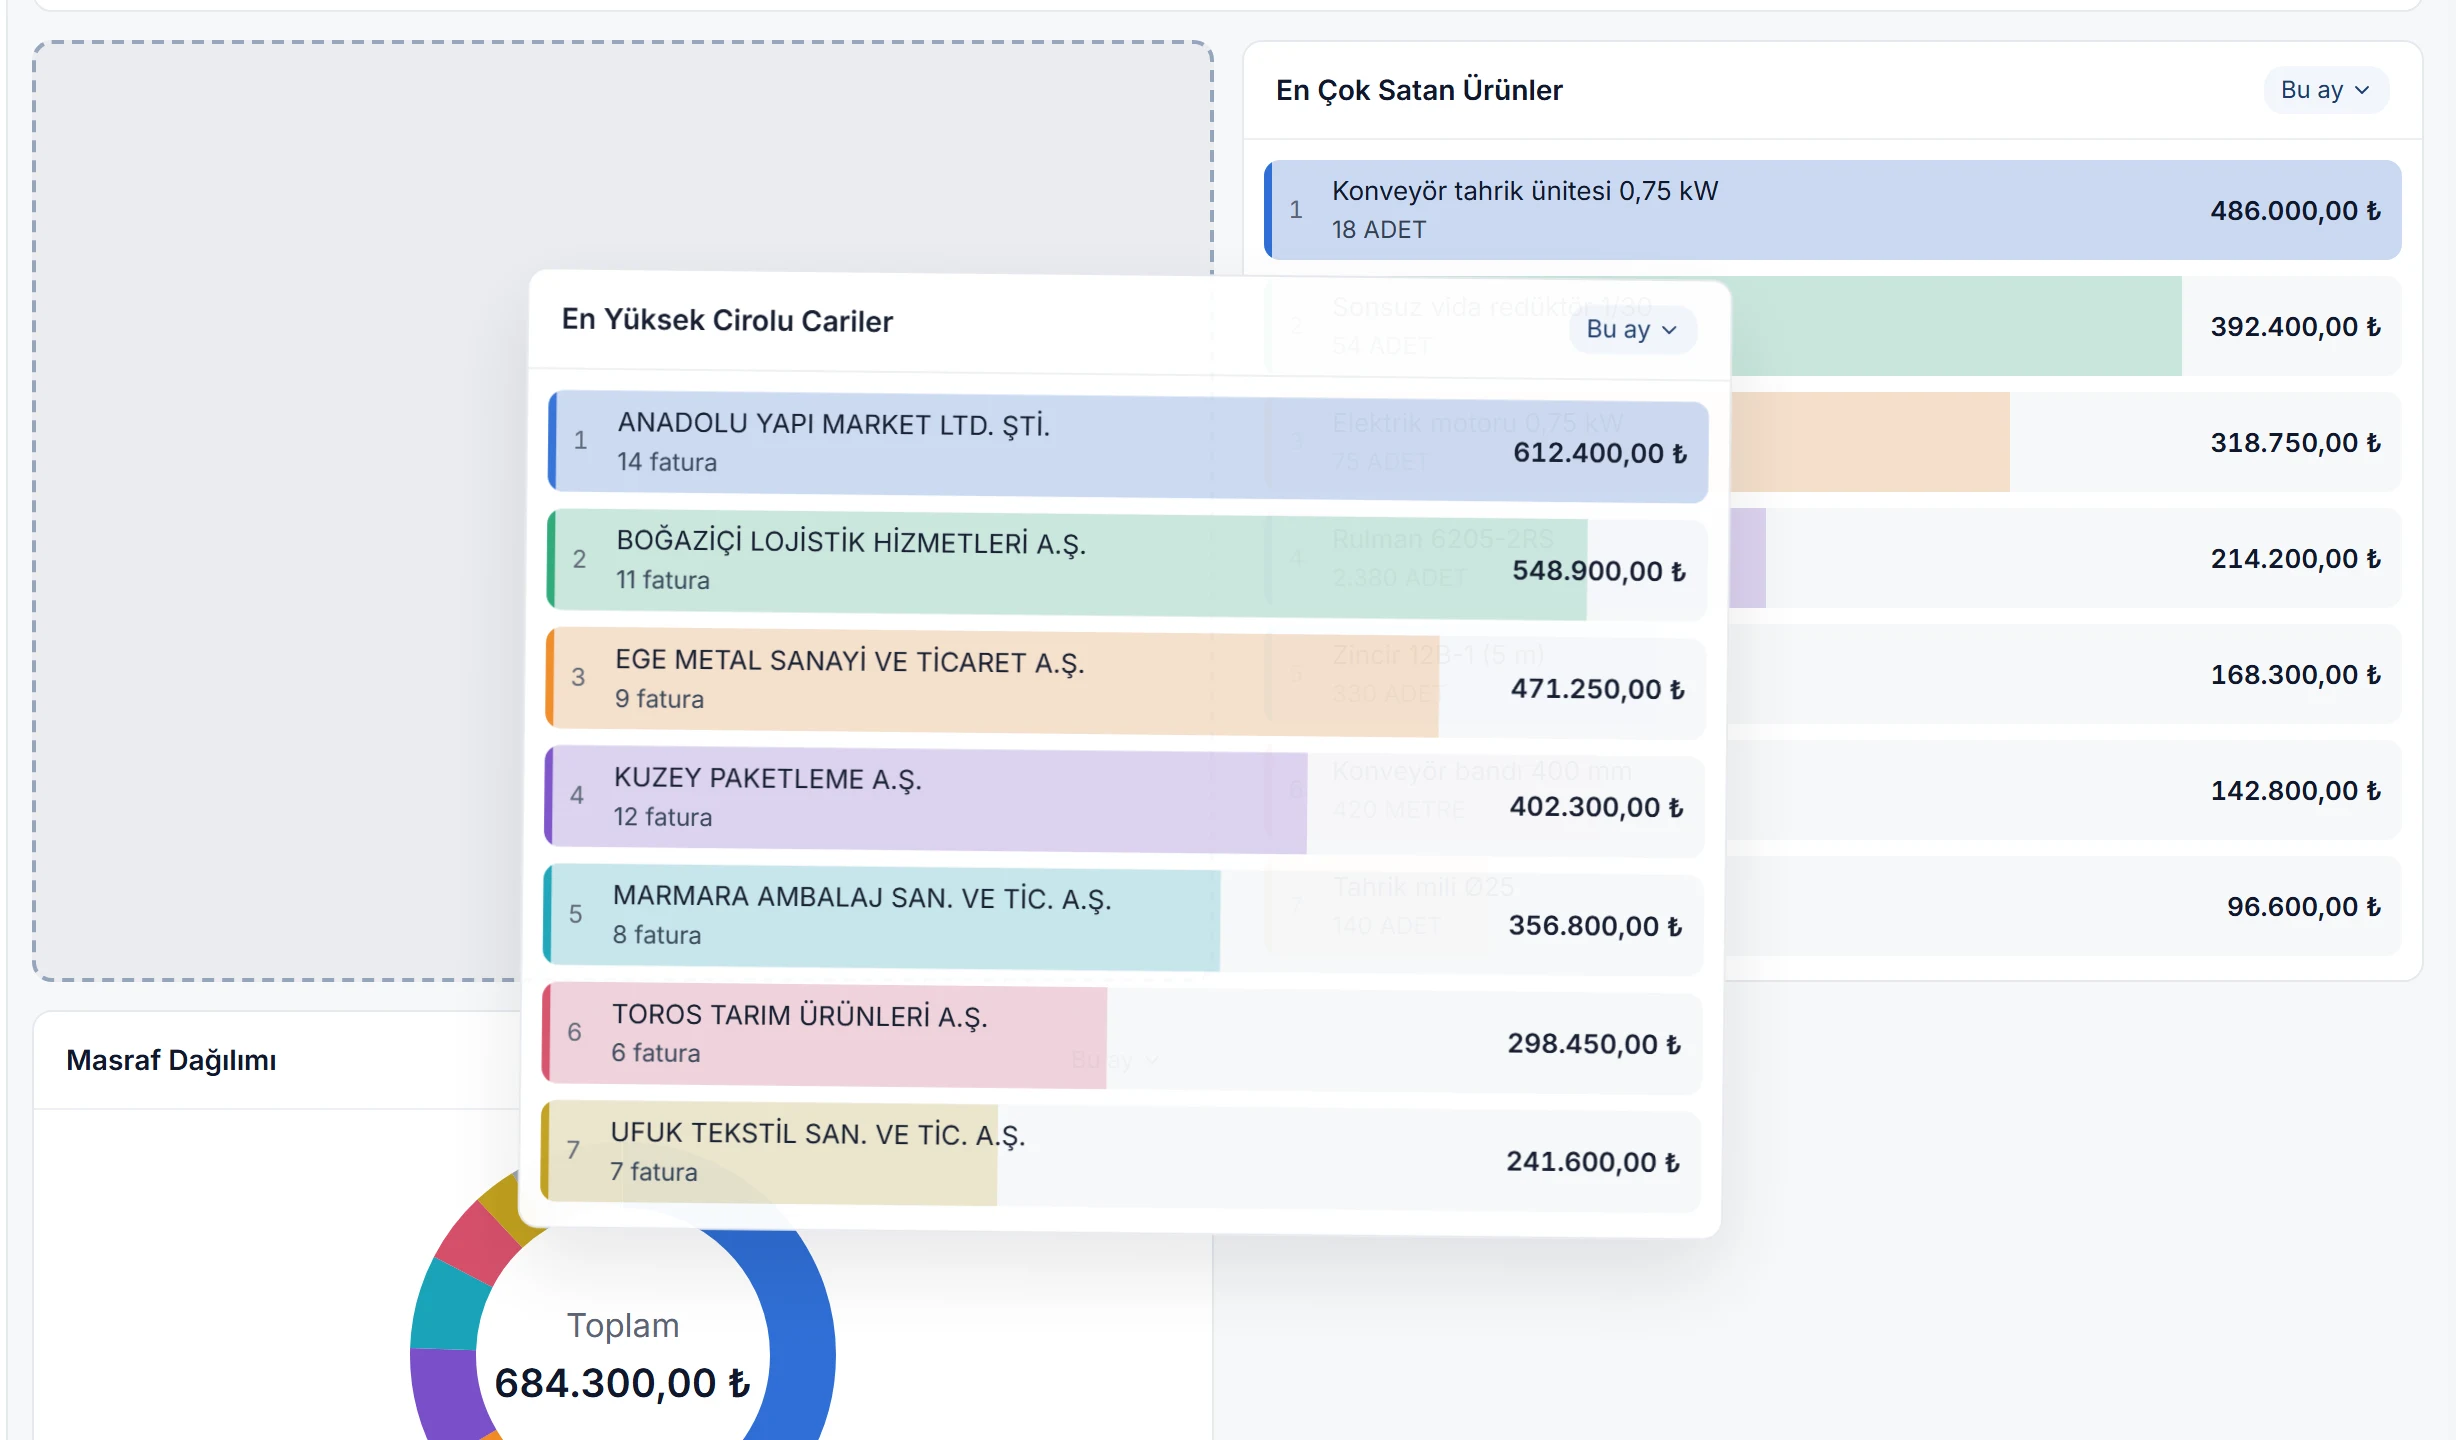
Drag a card by its header and it follows the pointer while its new place shows as an empty dashed slot. Move it over another card and the others slide aside to make room; let go and the card drops into place and the new order is saved straight away.

  • Cards line up side by side to fit the screen; wide charts take two card widths when there is room.
  • Press Esc to cancel a drag and the cards go back where they were.
  • On phones and tablets cards don’t drag, so the page scrolls freely; change the order from Dashboard charts.
The dashboard while dragging: the Top customers by revenue card floating with the pointer, its new place a dashed slot, Best-selling products moved aside Enlarge image

Financial position

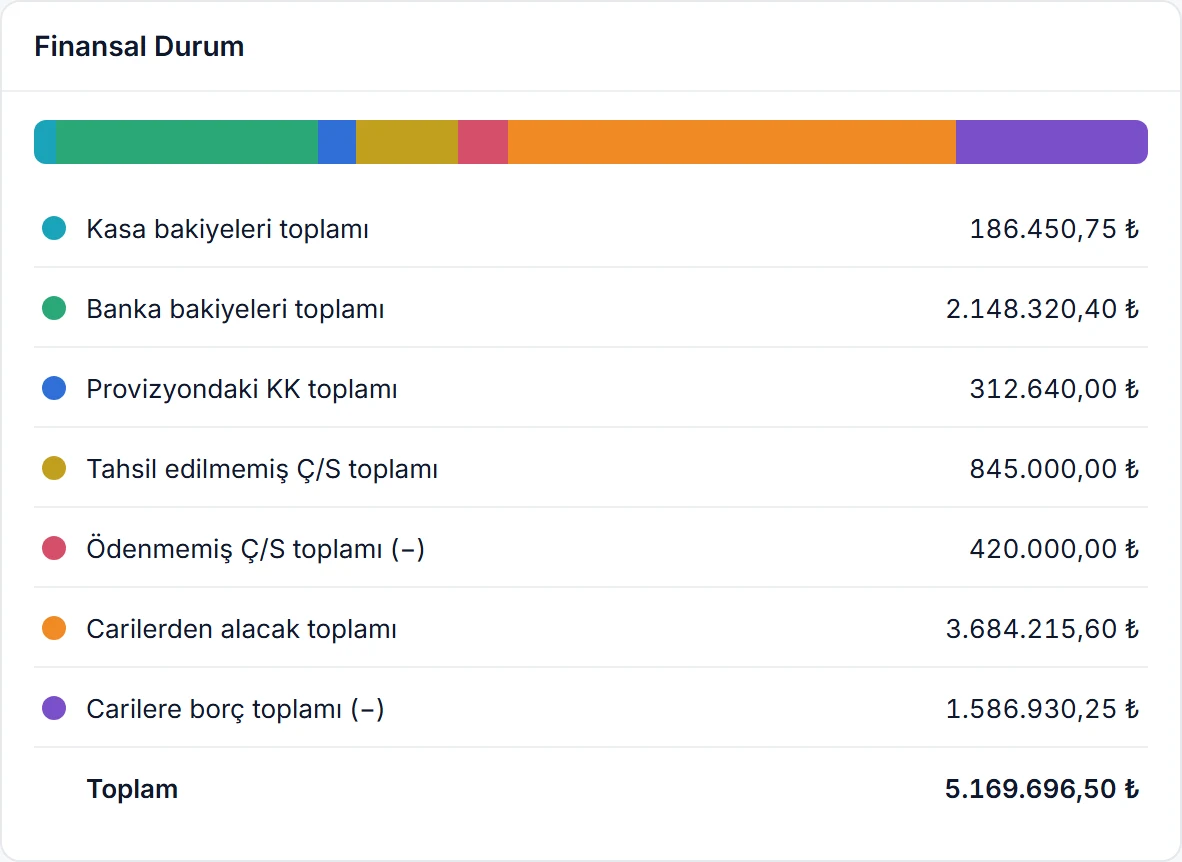
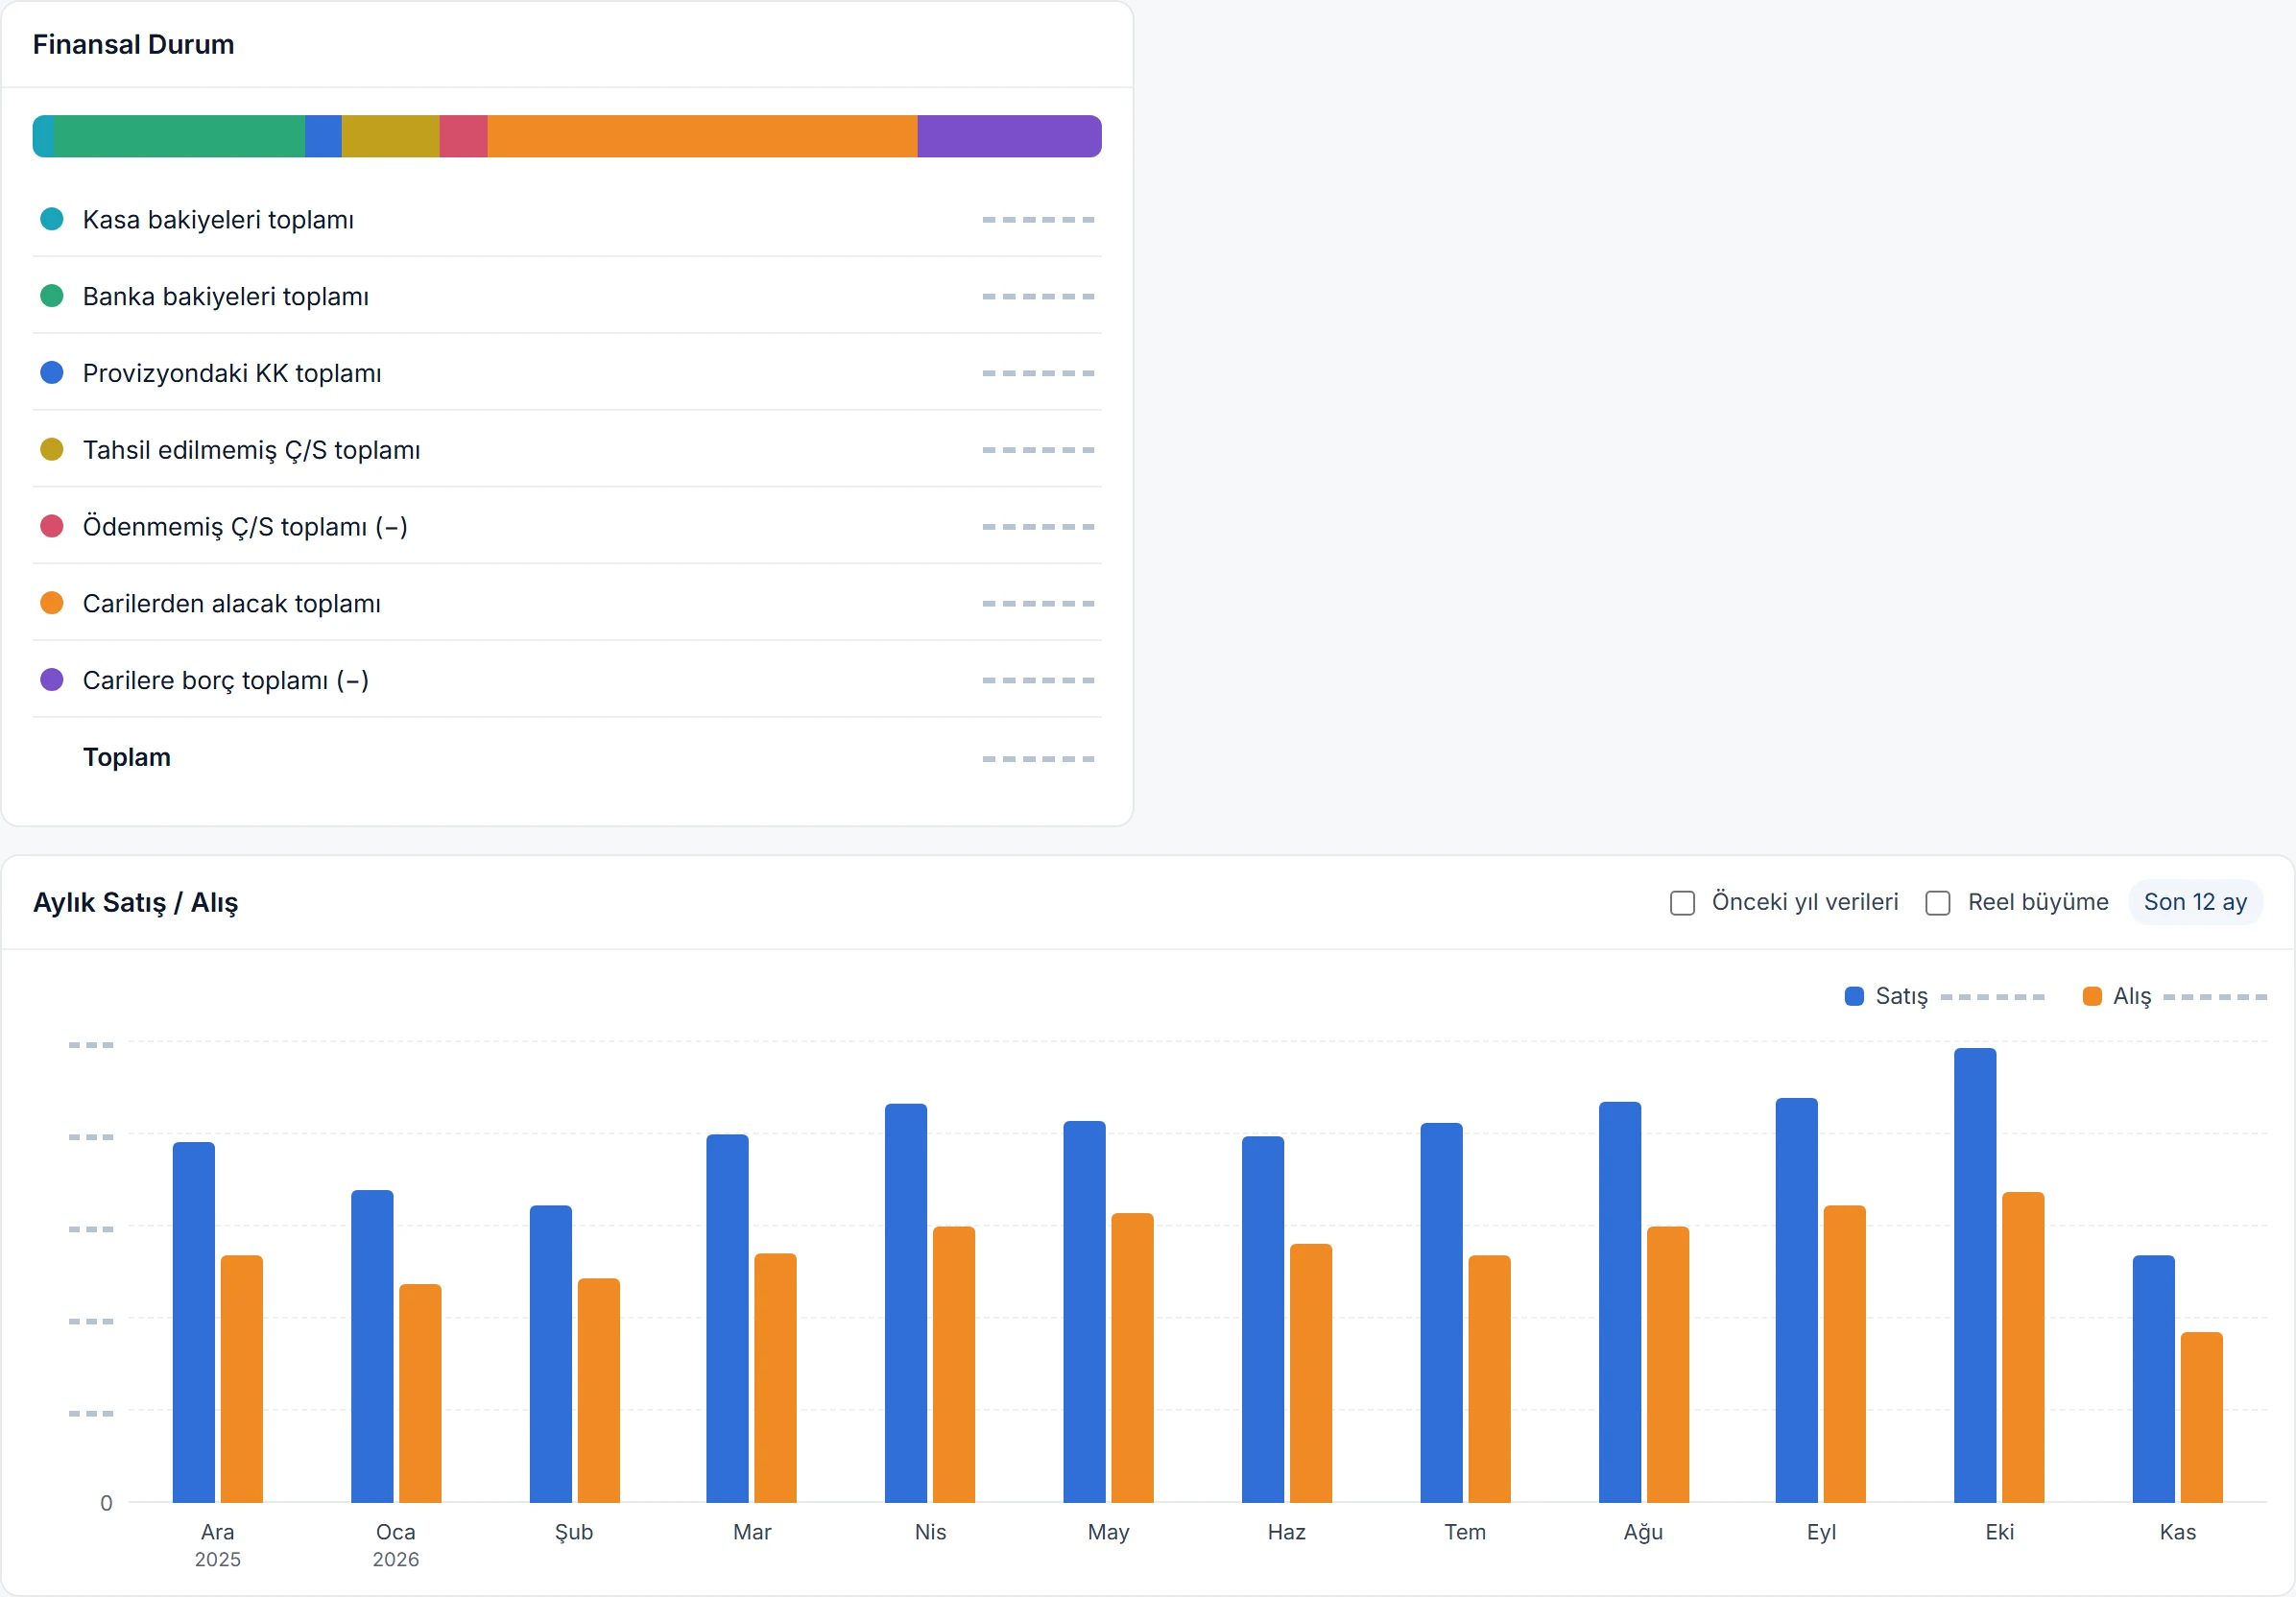
Your company’s money position right now on one card: cash and bank balances, card payments awaiting settlement, uncollected and unpaid cheques and notes, what customers owe you and what you owe. The total subtracts the minus lines.

  • The coloured strip on top shows each line’s amount relative to the others.
  • Foreign-currency balances are converted to the company’s default currency at today’s rate.
Financial position card: under a coloured strip, totals for cash, bank, card settlements, cheques and notes, customer receivables and payables, and the grand total Enlarge image

Best-selling products and top customers

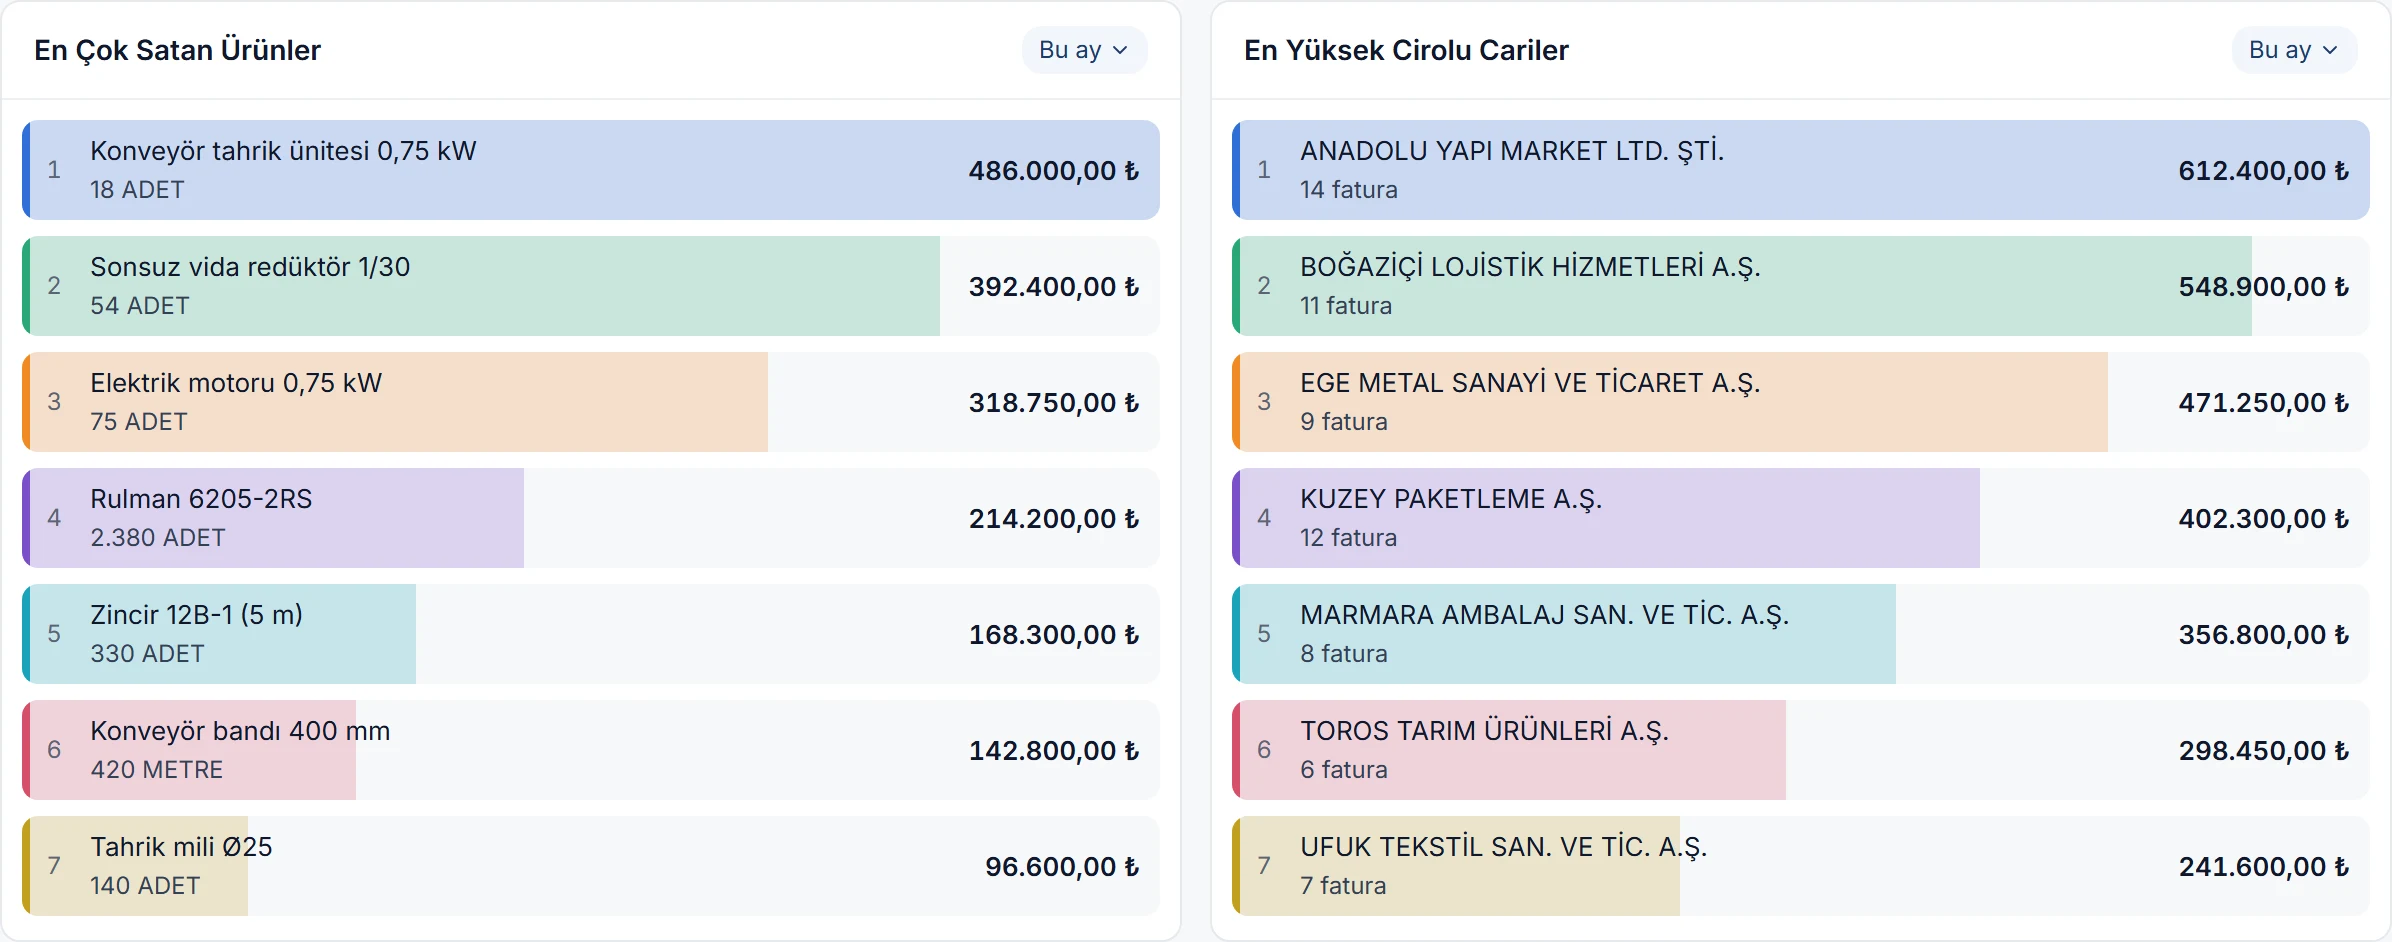
The 7 products with the highest sales and the 7 customers with the highest revenue in the date range you choose. The quantity sold is under each product and the invoice count under each customer; each row fills in proportion to the largest amount.

  • Pick the date range in the card’s header; each chart keeps its own range.
  • Click a row to open the product or customer card.
Best-selling products and Top customers by revenue side by side: rank, name, quantity sold or invoice count, and amount Enlarge image

Expense breakdown

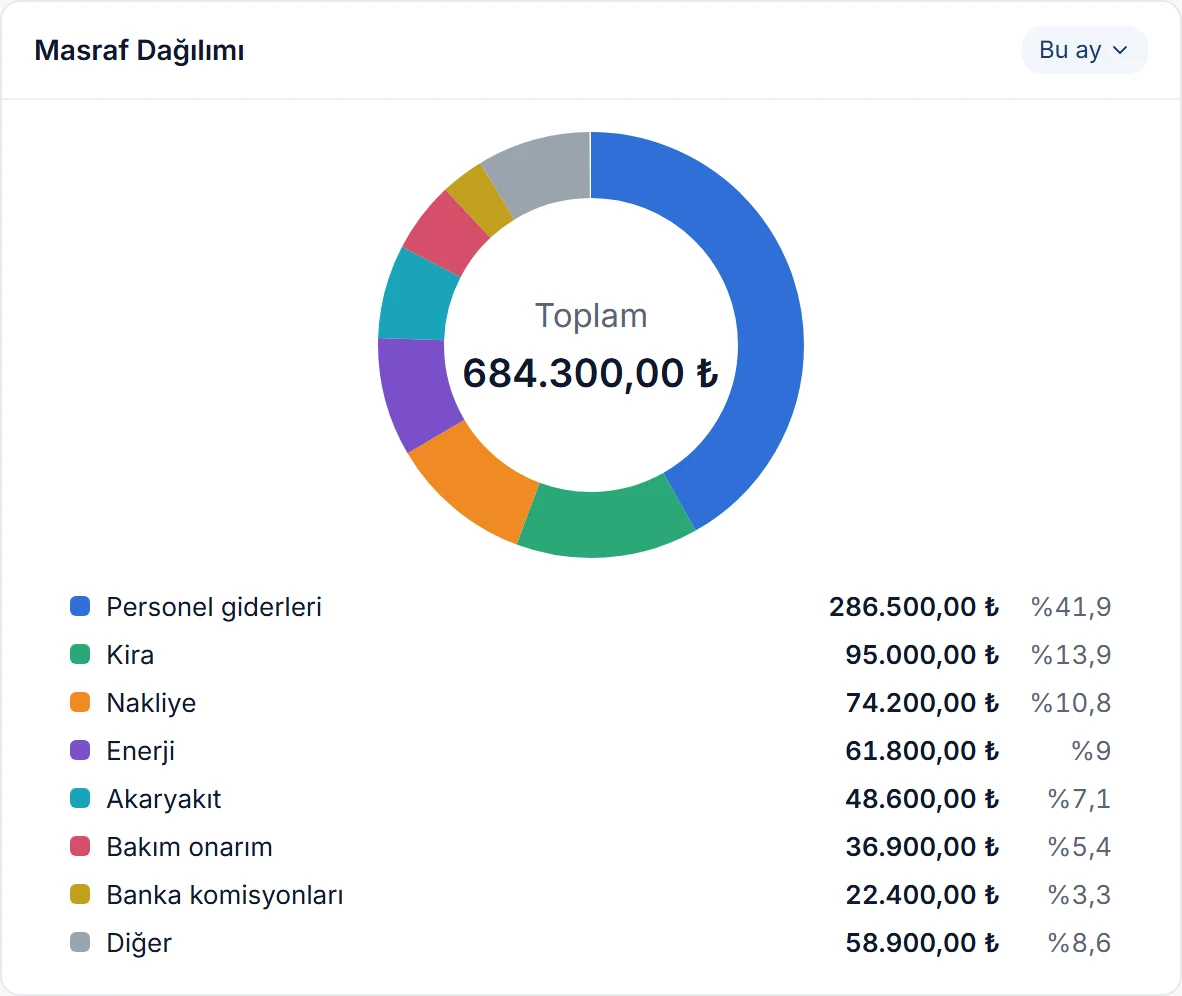
Where your expenses go, in a donut chart: expense vouchers from cash and bank, credit card commissions, and expense lines in offset vouchers and purchase invoices. The total is in the middle, with each expense’s amount and share below.

  • With more than 8 expenses, the 7 largest are shown separately and the rest as Other.
Expense breakdown card: a donut chart with the total in the middle, and below it the amount and share of expenses such as staff, rent, freight and energy Enlarge image

Sales by province

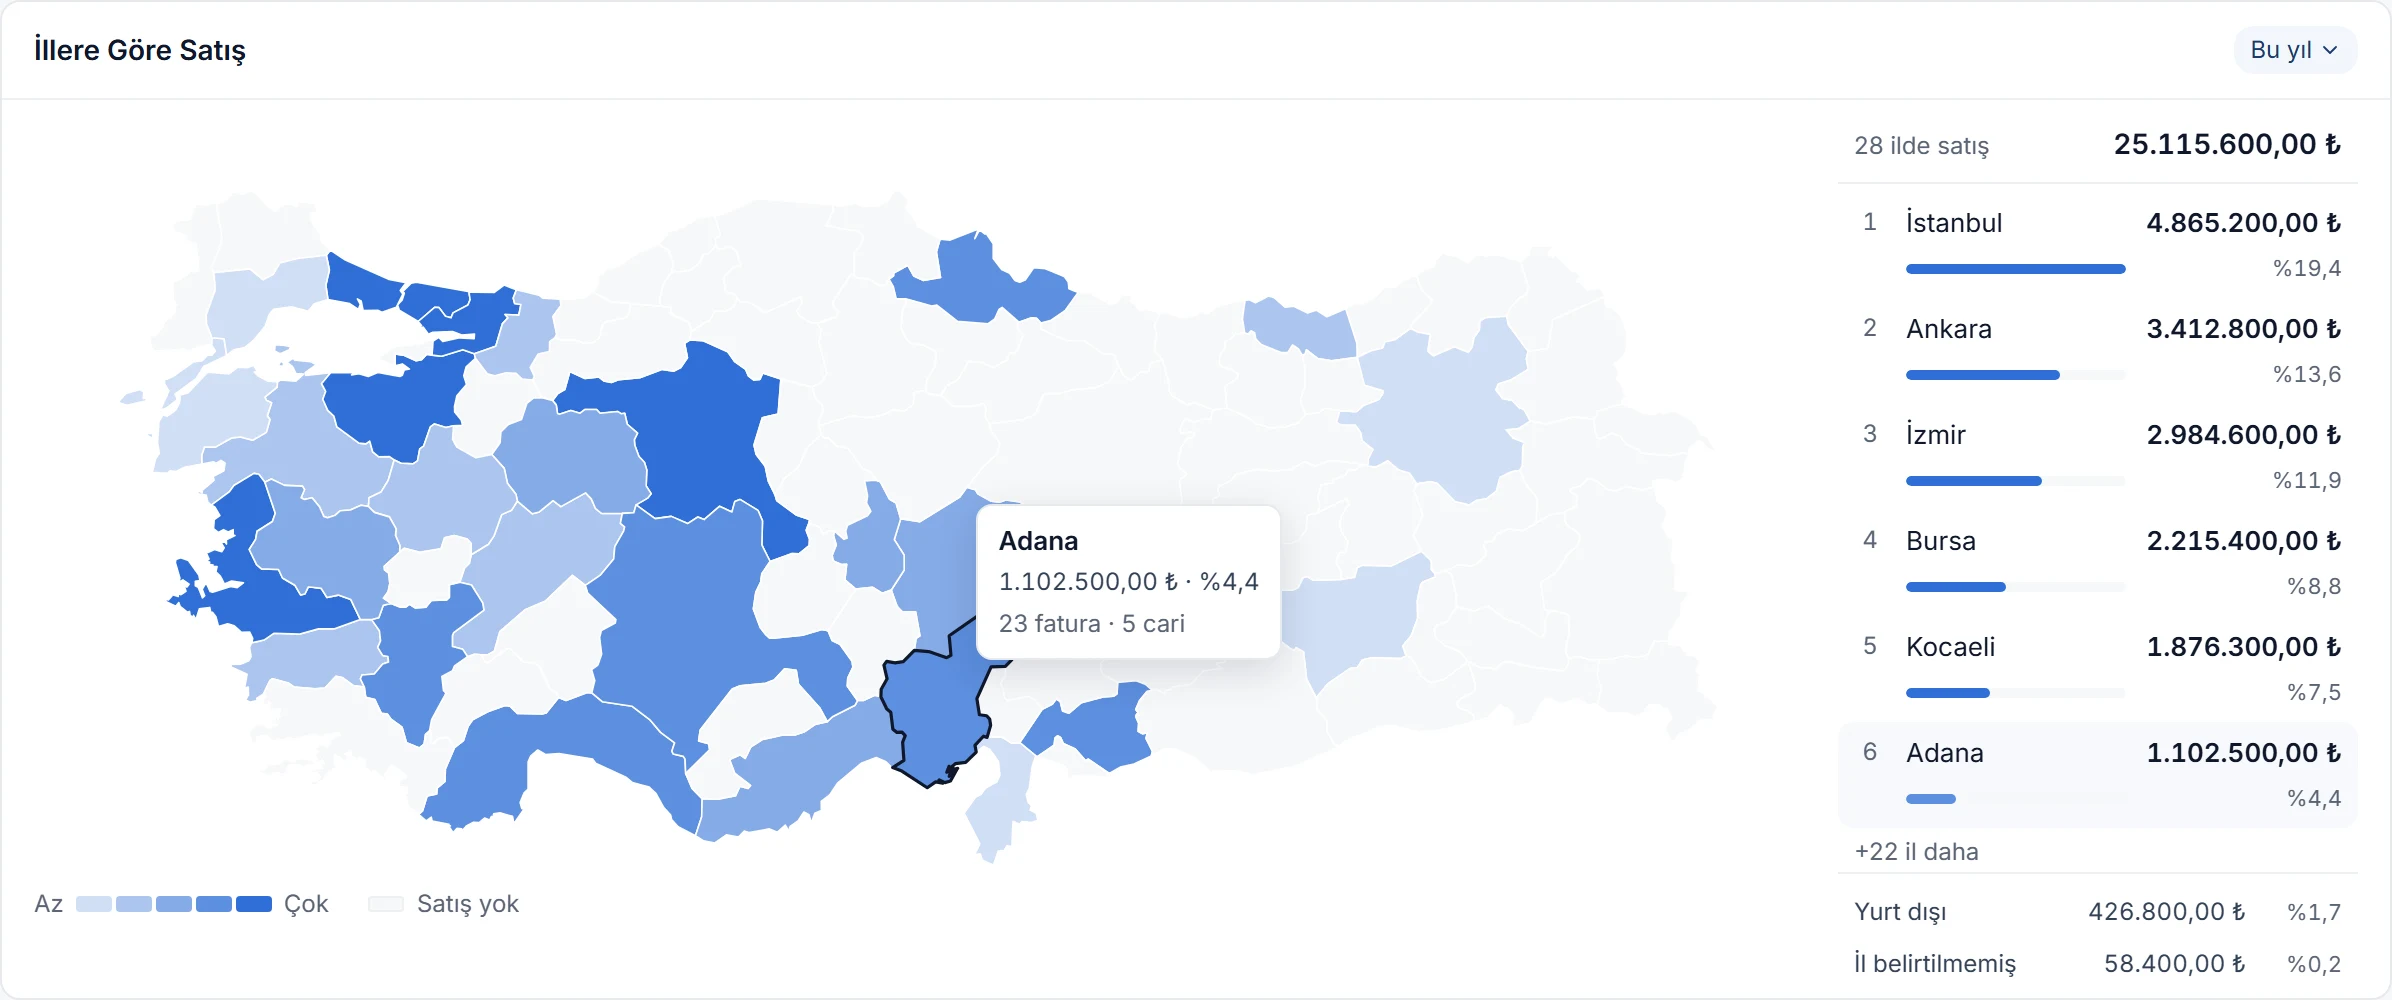
Your sales on a map of Türkiye, by the province of the customer’s address: the provinces you sell most in are the darkest. On the right, the number of provinces with sales, the total and the top 6 provinces; sales abroad and invoices without a province have their own rows.

  • Hover a province for its amount, share of the total, and invoice and customer counts.
  • Click a province to see its breakdown by district and its customers.
Sales by province card: a map of Türkiye shaded blue by sales, the tooltip for Adana and the top provinces on the right Enlarge image

Due date calendar

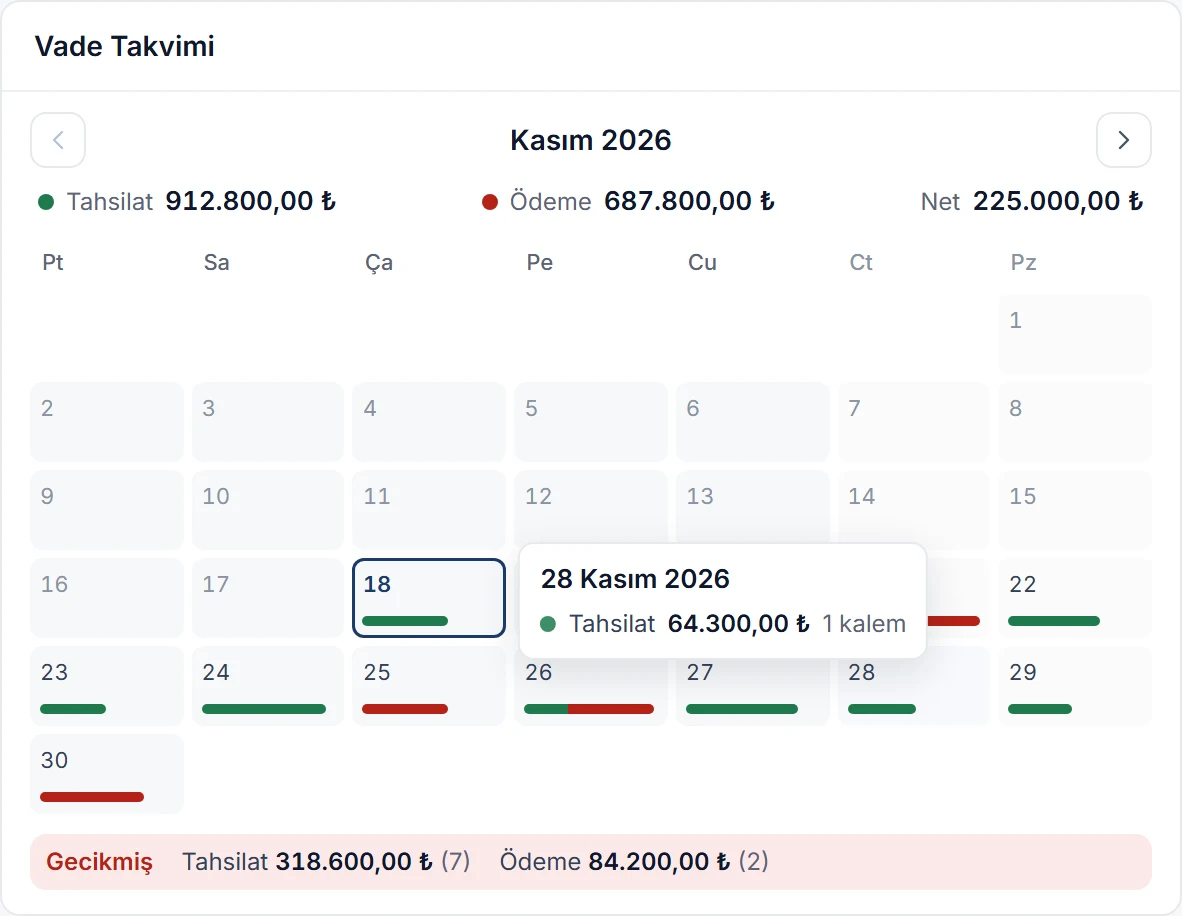
The month’s expected collections and payments, day by day like a calendar: customer transactions, cheques and notes, card payments awaiting settlement, and routine income and expenses such as salaries and rent. The green part of a day’s strip is collections, the red part payments.

  • The month’s collections, payments and net total are on top; past-due items sit in the Overdue row at the bottom.
  • Click a day to see its items; you can go up to 11 months ahead.
Due date calendar card: the days of the month with green and red strips under days with collections and payments, and overdue collections and payments at the bottom Enlarge image

Cash flow

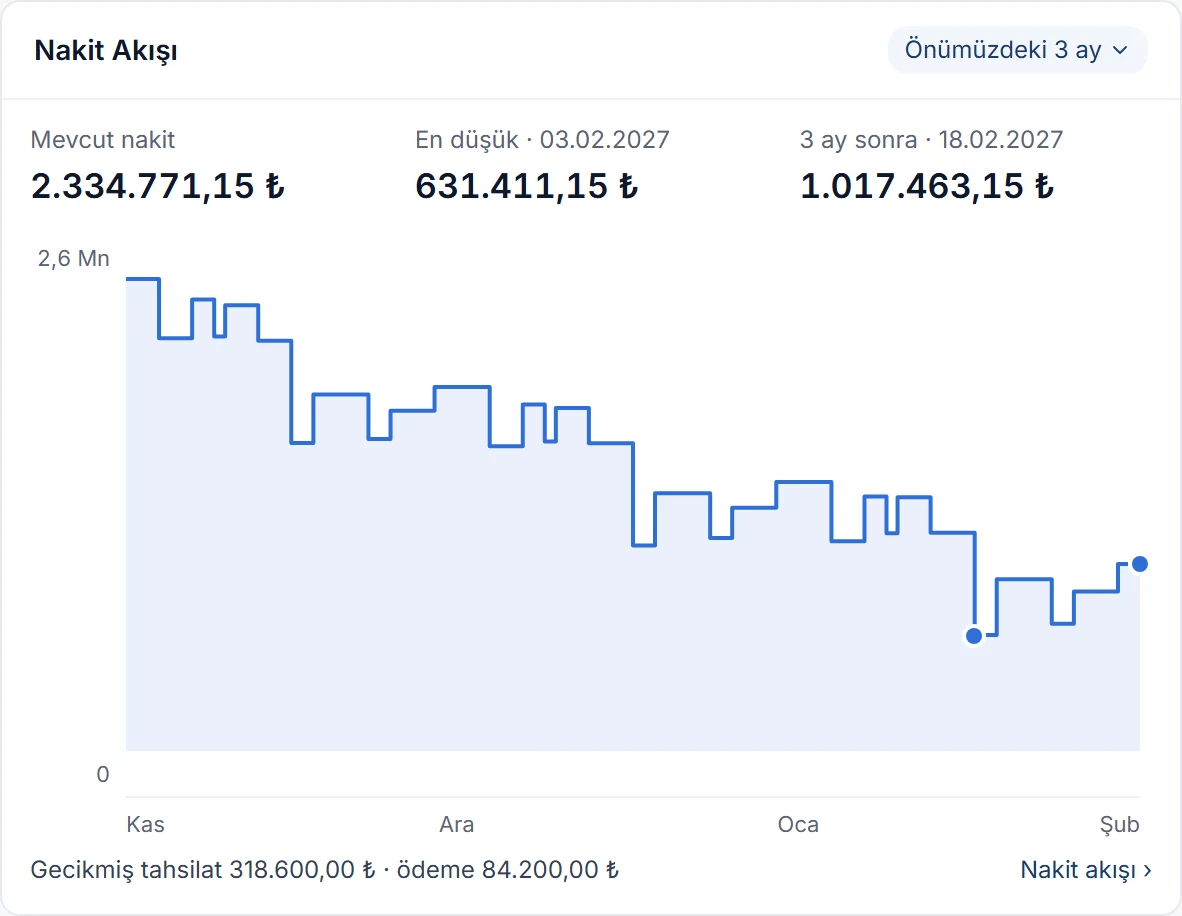
How the money in your cash desks and bank accounts will move over the coming months: starting from today’s cash, the balance changes with every collection and payment. On top you see available cash, the lowest balance and its date, and the balance at the end of the period.

  • Choose the next 1, 3 or 6 months in the card’s header.
  • If the balance would drop below zero, the zero line and the lowest point are marked, so you can plan payments ahead.
Cash flow card: available cash, the lowest balance and the balance in 3 months, with a stepped balance line below Enlarge image

Open receivables

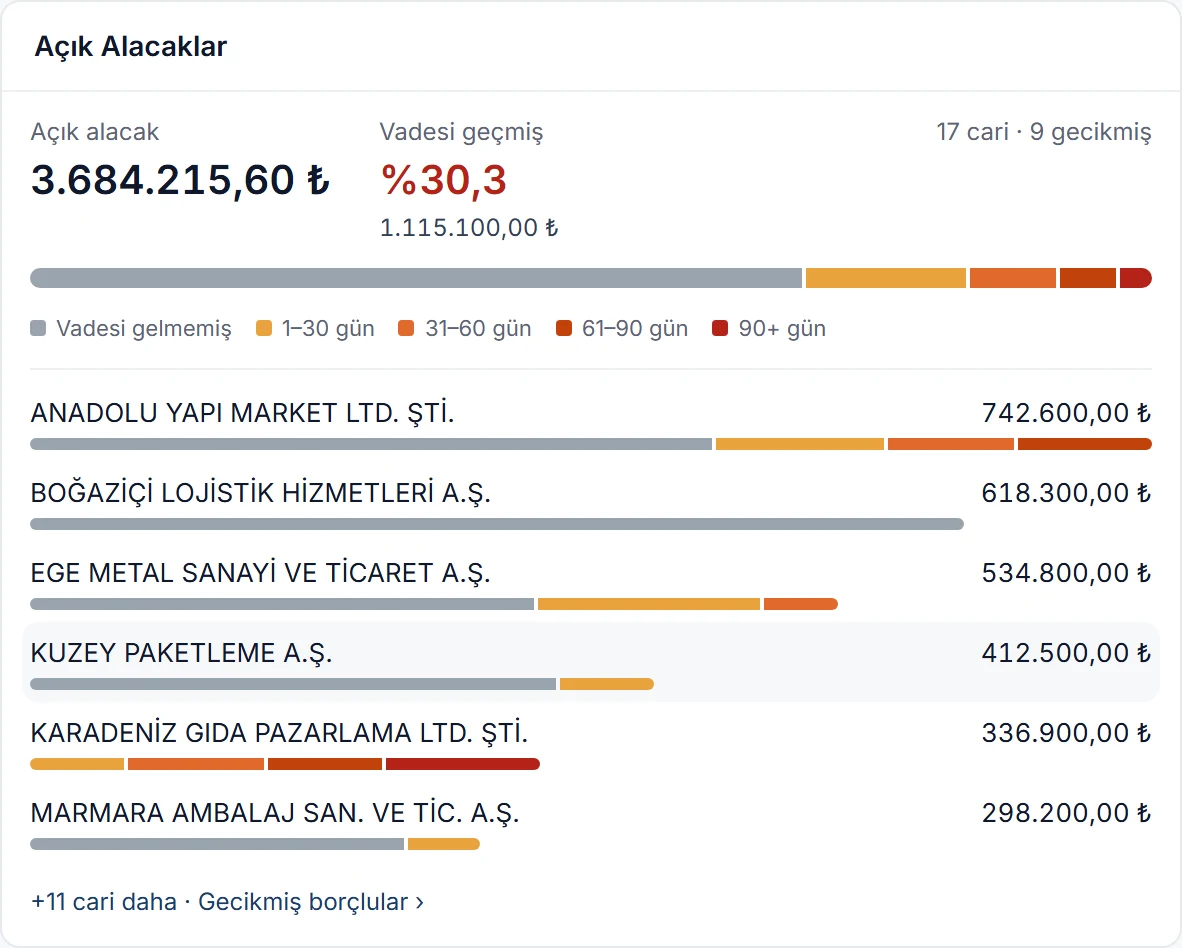
How much customers owe you in total, how much of it is overdue and who owes you the most. The coloured bar splits receivables into ageing buckets: not yet due, 1–30, 31–60, 61–90 and more than 90 days.

  • The 6 customers who owe you the most are listed with their own ageing buckets.
  • Click a customer to see their open items, then jump to the document, the customer card or debit-credit matching.
Open receivables card: total receivables, overdue share, a bar split into ageing buckets, and the customers who owe the most Enlarge image

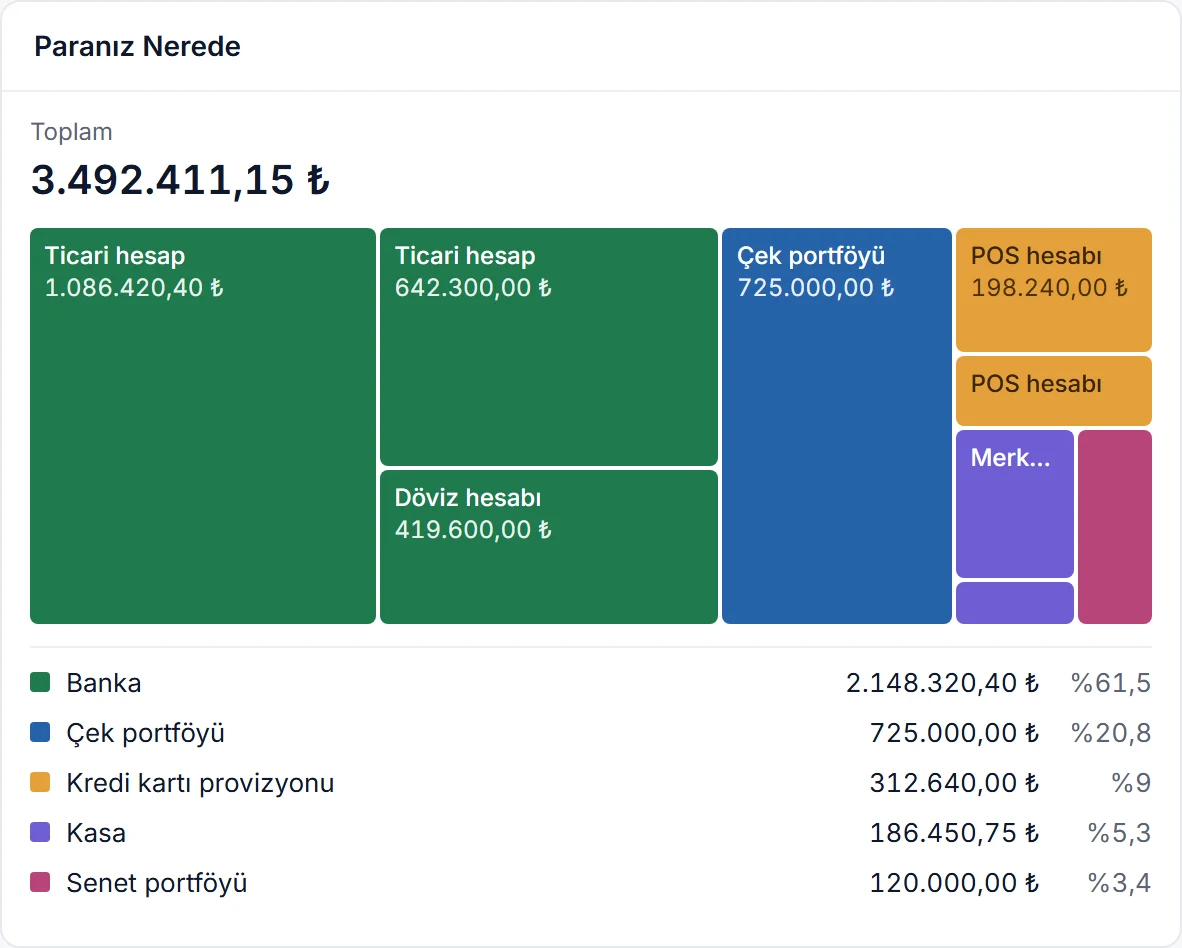
Where your money is

Which bank account, cash desk, card settlement or cheque and note portfolio your money sits in: each box is sized by its balance. The totals and shares of each type are listed below.

  • Click a box to open the bank account or cash desk statement, or the cheque or note list.
  • Accounts below zero are listed separately and subtracted from the total.
Where your money is card: boxes sized by balance for bank accounts, the cheque portfolio, POS accounts, cash desks and the note portfolio; type totals and shares below Enlarge image

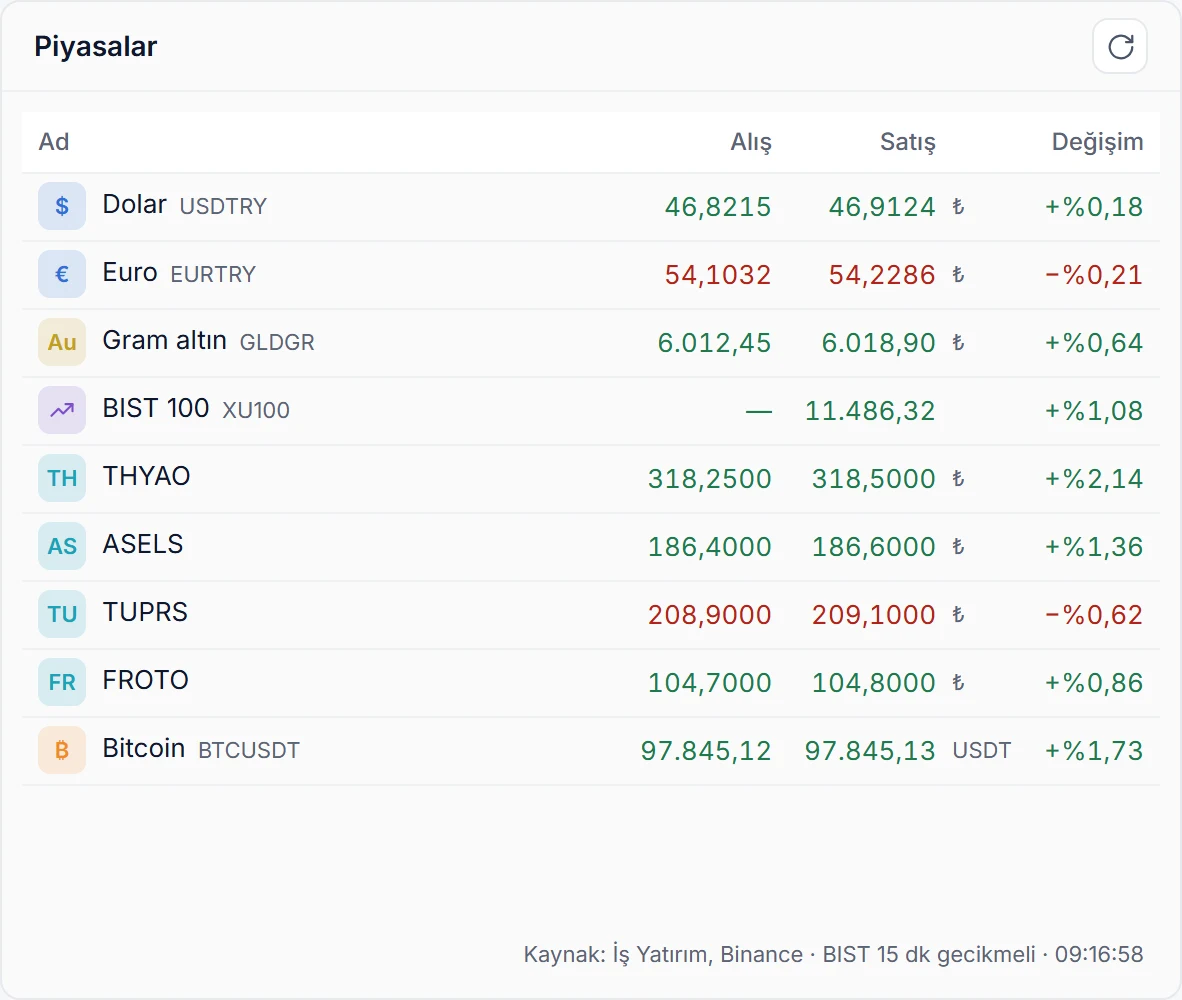
Markets

Currency, gold, commodity, stock index, share and crypto prices on your dashboard. Buying, selling and daily change side by side; green when up, red when down. While the dashboard is open the table refreshes itself every minute, so you can follow the markets without leaving the screen.

  • Prices come from İş Yatırım and Binance.
  • The card’s own Refresh button refreshes only this table.
Markets card: buying, selling and daily change for the dollar, euro, gram gold, BIST 100, THYAO, ASELS, TUPRS, FROTO and Bitcoin Enlarge image

Follow the shares in your portfolio

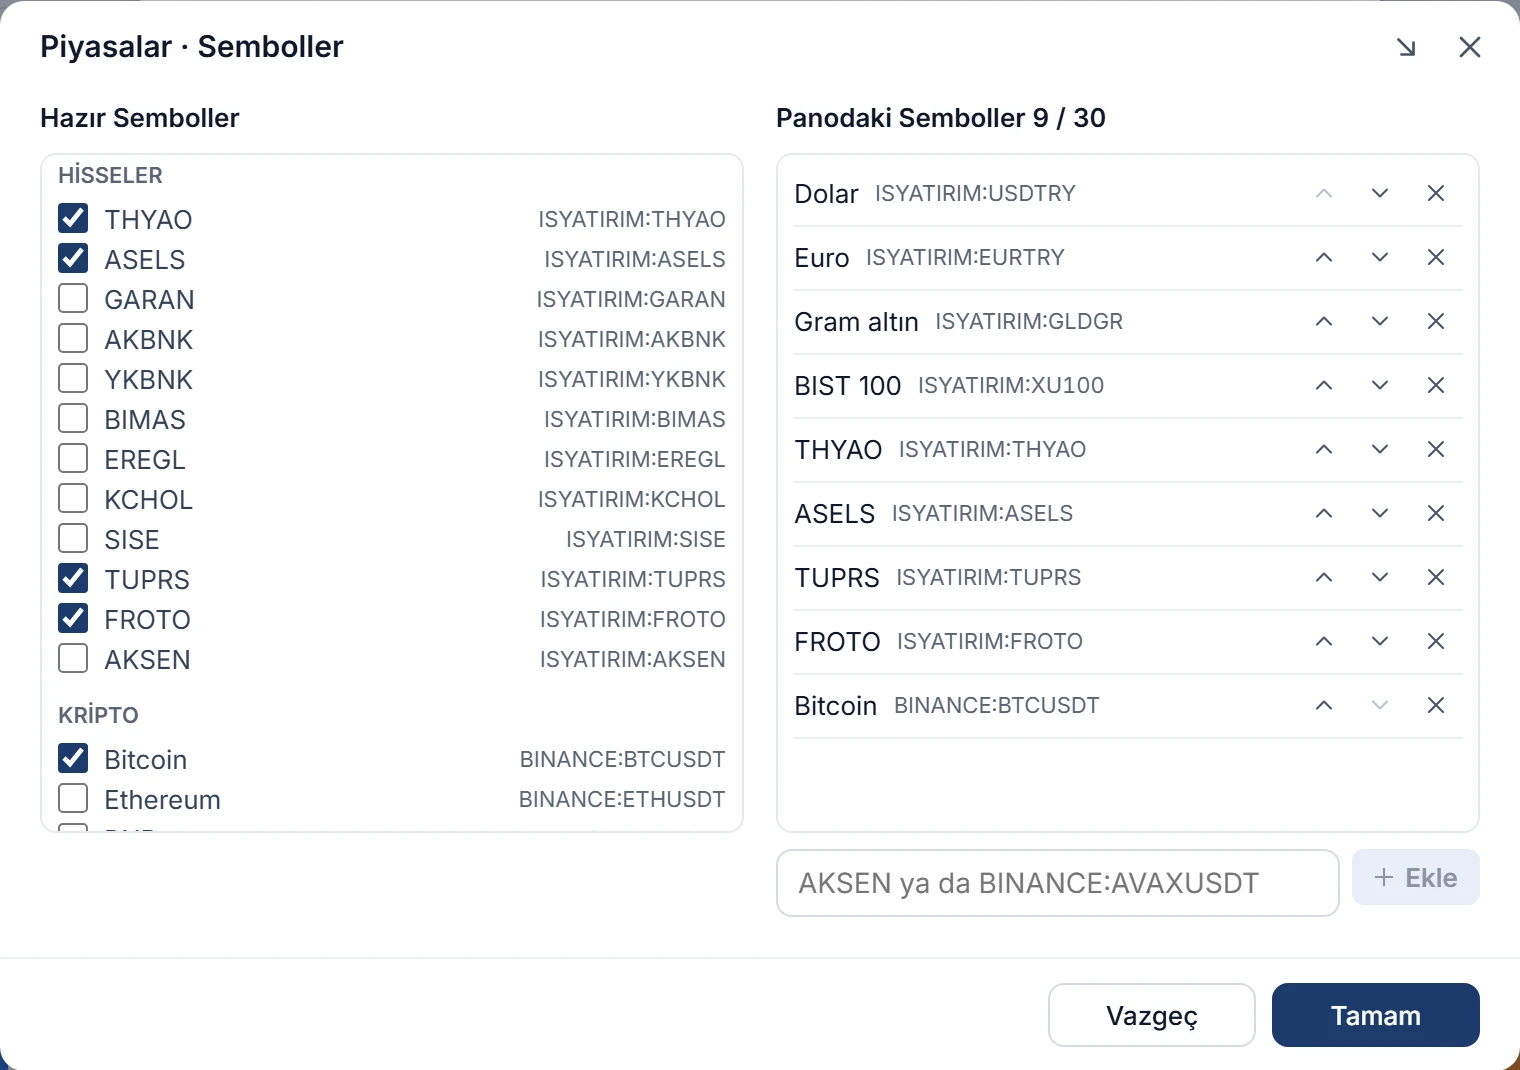
Pick the shares in your investment portfolio and follow them live from your dashboard. The preset list has frequently watched BIST shares, currencies, precious metals, indices and crypto; add a share that isn’t listed by its code.

  • Type a symbol that isn’t listed to add it: a BIST share by its code (e.g. AKSEN), crypto as a pair with the BINANCE: prefix. The symbol is looked up at the source before it’s added.
  • Up to 30 symbols fit on the dashboard; reorder them with the arrows and remove the ones you don’t want.
  • Prices refresh every minute; BIST prices are delayed by 15 minutes.
Markets · Symbols window: on the left the preset list with THYAO, ASELS, TUPRS and FROTO ticked, on the right the 9 symbols on the dashboard and the box for adding a symbol Enlarge image

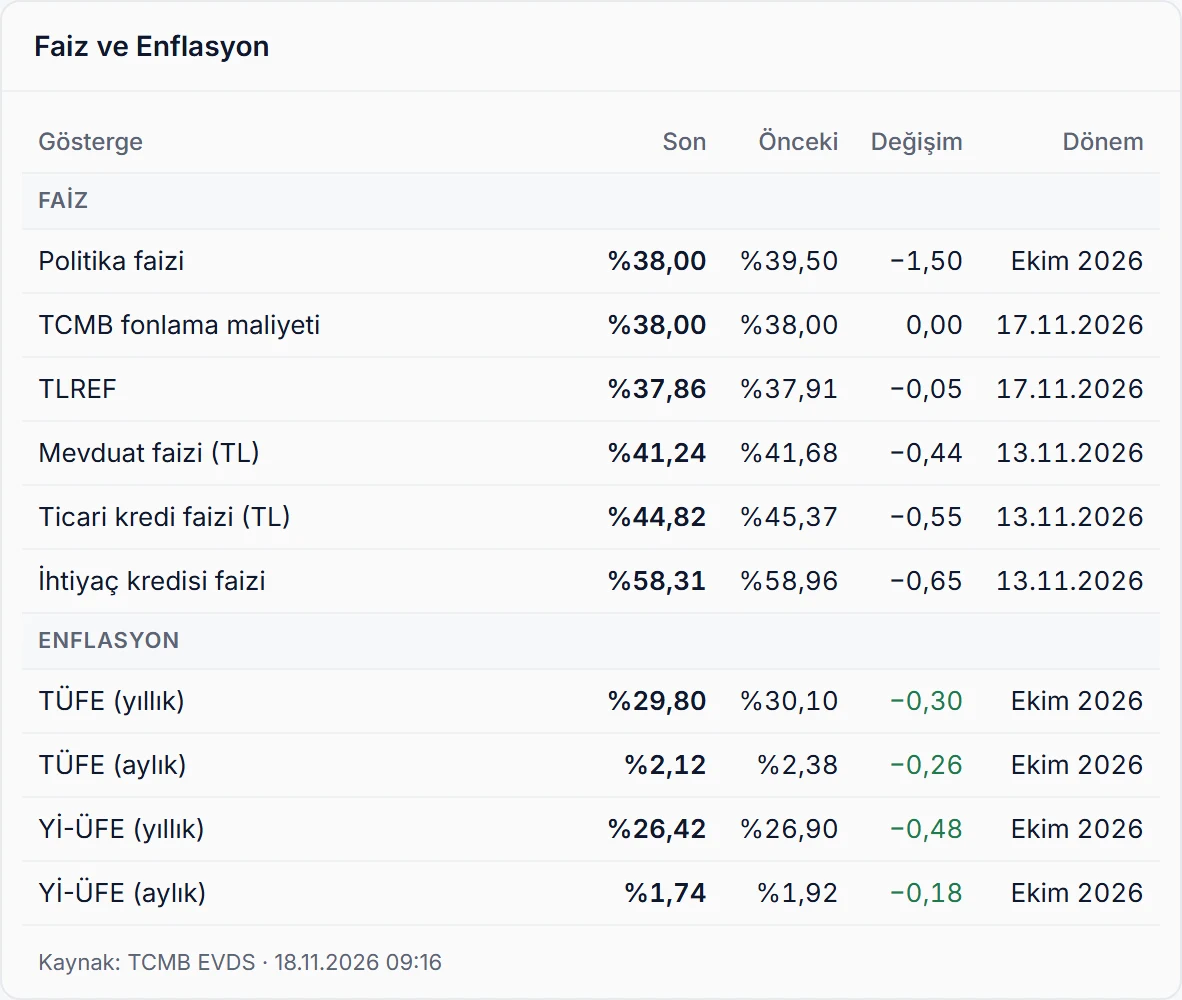
Interest and inflation

From the Central Bank’s data service: the policy rate, the CBRT funding cost, TLREF, deposit and loan rates, and annual and monthly CPI and domestic PPI. For each indicator, the latest and previous value, the change in points and the period side by side.

  • A rise in inflation is red, a fall green.
  • Values are fetched from the source at most every 3 hours.
Interest and inflation card: the latest and previous value and the change for the policy rate, funding cost, TLREF, deposit and loan rates, CPI and PPI Enlarge image

Tax and SGK calendar

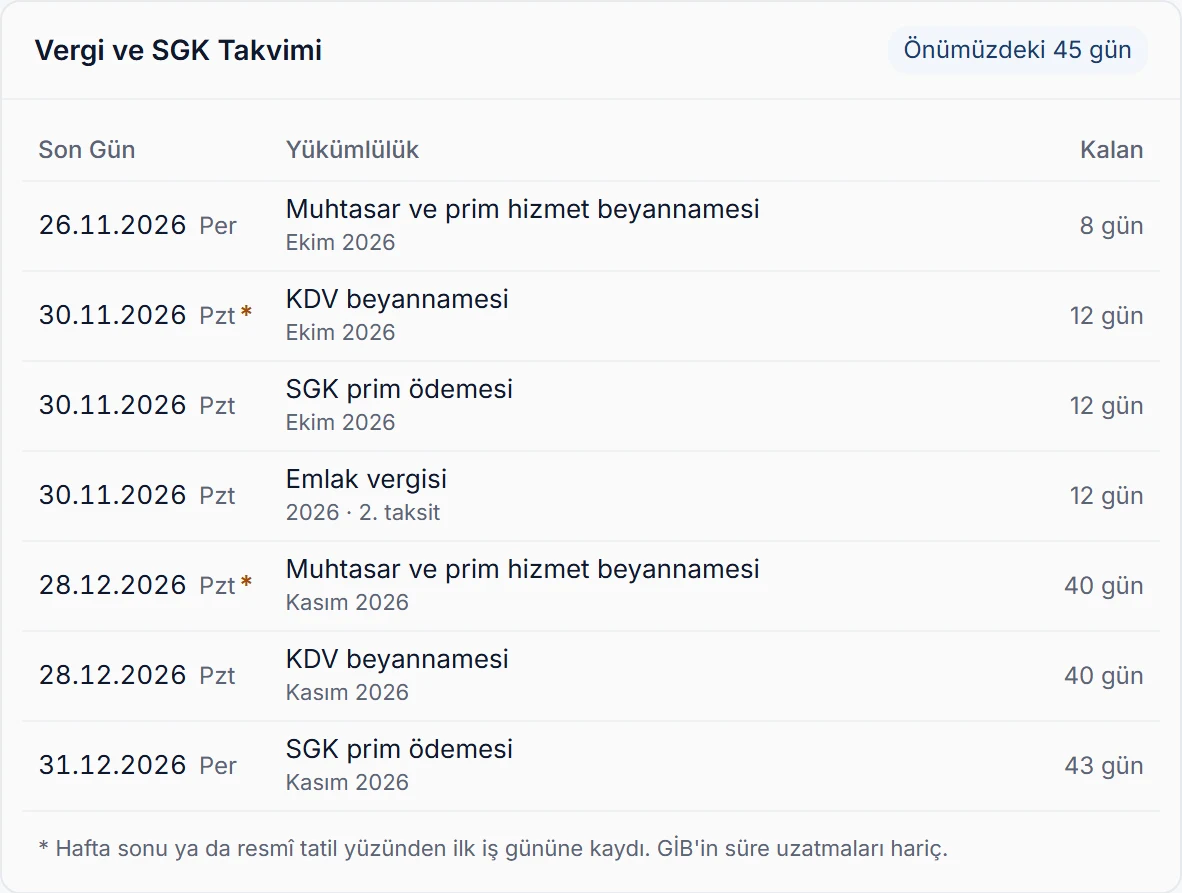
Filing and payment deadlines for the next 45 days, nearest first: withholding and premium returns, VAT, social security premiums, provisional tax, income and corporate tax, and motor vehicle and property tax instalments. Days left are on the right; rows turn yellow as the deadline nears and red on the day.

  • A deadline falling on a weekend or public holiday moves to the next working day; the star next to the date shows the legal day.
Tax and SGK calendar card: deadlines for withholding, VAT, social security and property tax, with periods and days left Enlarge image

Balance confirmation status

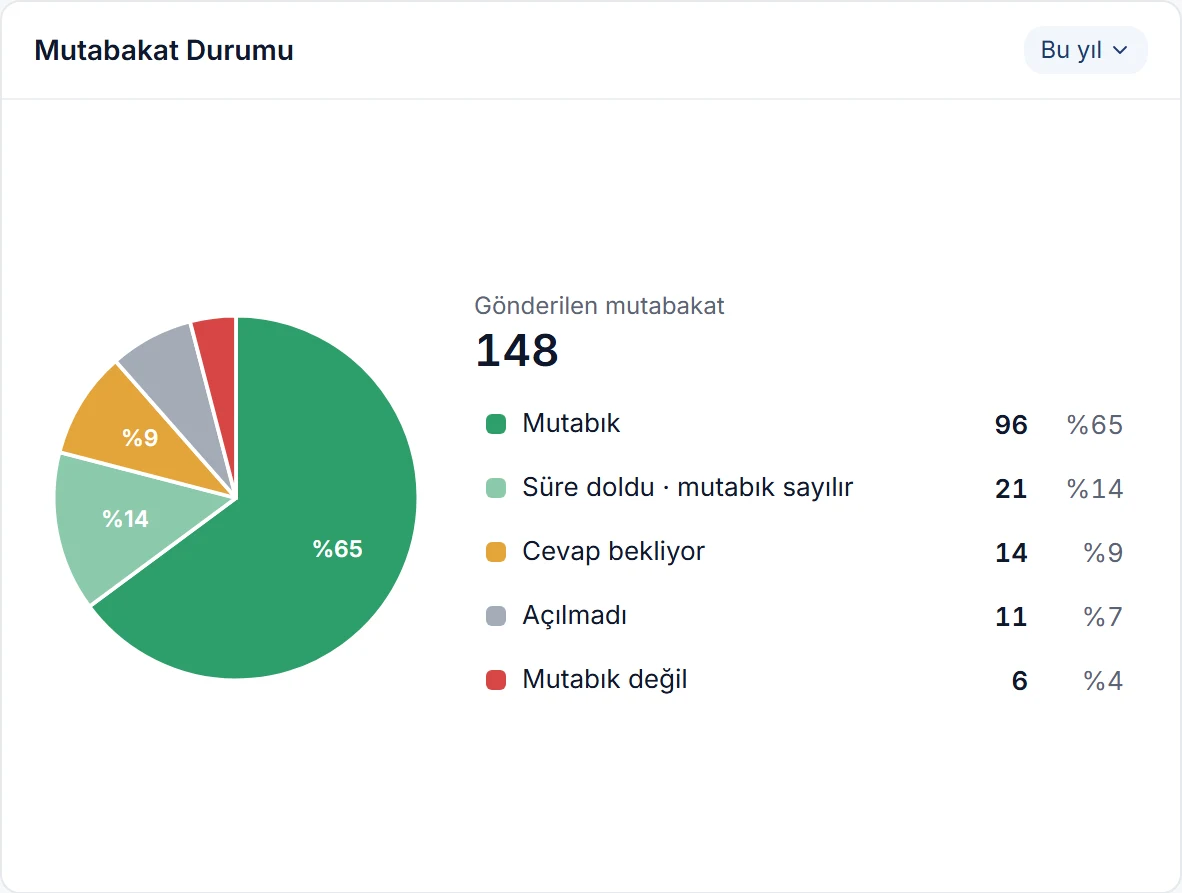
Where the balance confirmations you sent stand, in a pie chart: confirmed, deemed confirmed after the deadline, awaiting reply, not opened, and not confirmed. The count and share of each status are listed beside it.

  • Click a slice to open the balance confirmations list with that status and the same date range.
  • The card is hidden at first; if you send balance confirmations, turn it on in Dashboard charts.
Balance confirmation status card: 148 sent confirmations split into confirmed, deadline passed, awaiting reply, not opened and not confirmed Enlarge image

Hide amounts

Sharing your screen or in a meeting? Press the eye icon in the header and money amounts are replaced by dashed lines. Chart shapes, quantities, invoice counts and percentages stay; press it again and the amounts come back.

  • It’s a personal view setting; it doesn’t change anyone else’s screen.
The dashboard with Hide amounts on: dashed lines instead of amounts on the Financial position and Monthly sales / purchases cards, the strip and columns still in place Enlarge image

More dashboard features

Date ranges
Today, yesterday, this week, last 15 days, last 30 days, this month, last 3, 6 and 12 months, and this year. Each chart keeps its own range.
Refresh
Refresh in the header reloads every chart, so the figures update right after you enter new records.
One click to the record
Click product, customer, province, day and account rows to open the matching card, list or detail window.
Charts by permission
A user without permission in their permission scheme doesn’t see that chart on their dashboard.
Sharing codes
Records hidden from you by a sharing code stay out of the dashboard totals too, so two users may see different figures.
Default currency
All amounts are in your company’s default currency; foreign-currency records are converted at the exchange rate.

Set up your dashboard in a few clicks.

The dashboard feeds itself from your records; there’s nothing extra to enter. Your chart choices are saved to your user and look the same on every computer.

  1. Pick the charts

    Open Dashboard charts with the gear icon and tick the charts you want to see.

  2. Arrange them

    Drag cards by their header, or reorder them with the arrows in the window.

  3. Set the range

    Choose each chart’s date range from its own header; your choice is saved.

Set up your dashboard your way.

Try it free for 14 days. No credit card needed.